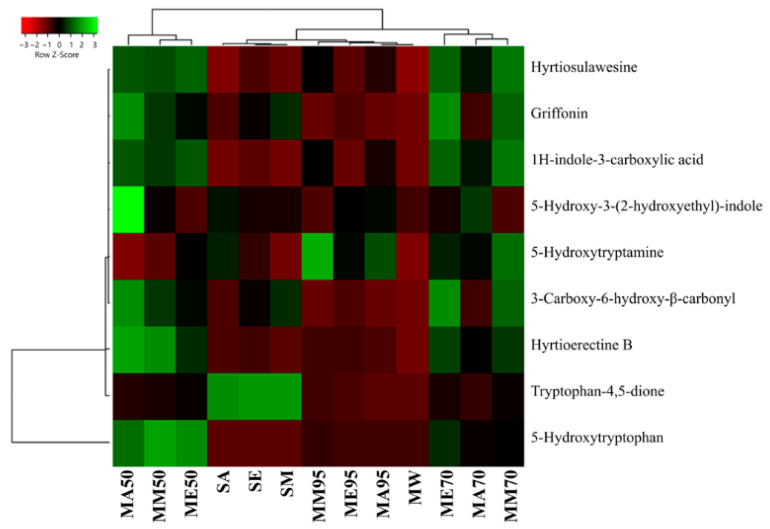
Figure 6.
Heatmap coupled to cluster analysis showing the alkaloid compound variation among the different extracts of G. simplicifolia. Quantitative data are supported in Supplementary Table S2. The dendrogram was generated using average linkage and Pearson distance methods; the different colors refer to the highest (green) or lowest (red) relative amounts of molecules among the analyzed extracts.

