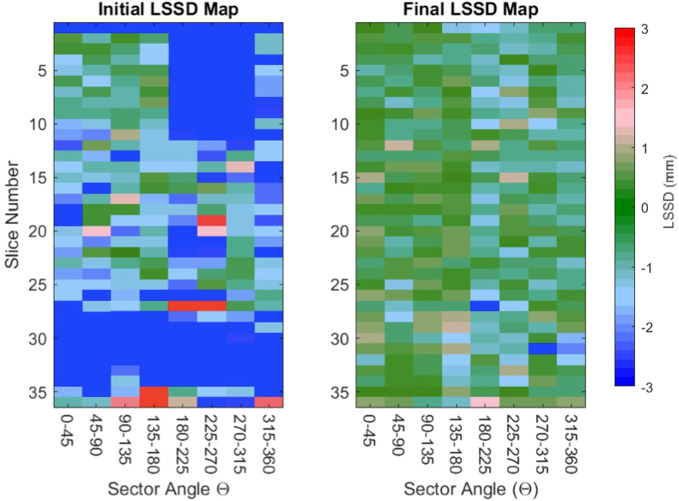
Figure 3.
Representative initial and final LSSD maps for one trainee. Two LSSD colormaps are presented as the contourer progresses through a training session. The initial LSSD map (left) has large sections of red and blue, indicating that the trainee’s contour is more than 3 mm from the reference contour in that sector. The final LSSD map (right) has an overall color closer to green, indicating that the trainee’s contours are approaching an LSSD of 0.

