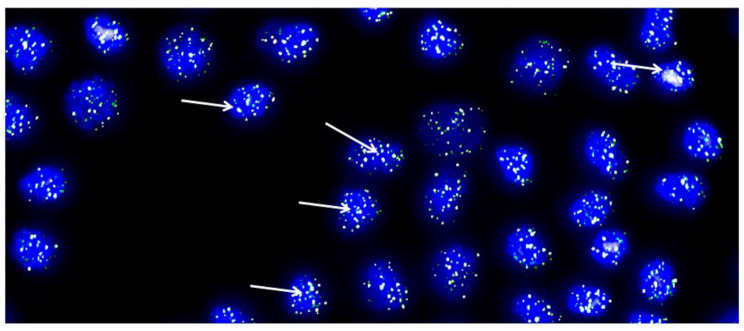
Figure 4.
Representative metaphase image from chondrocytes cultured from each cartilage biopsy. The image showcases DAPI-stained nuclei in blue, while the telomeres are visualized as green/white fluorescent signals. The images were captured with the Leica Q-FISH software, using a linear acquisition mode and an integration time of 400 ms to avoid oversaturation of fluorescence intensity. The recordings were made with a COHU CCD camera on a Leica Leitz DMRB fluorescence microscope. Several arrows have been added to indicate the location of some telomeres as an example [32].

