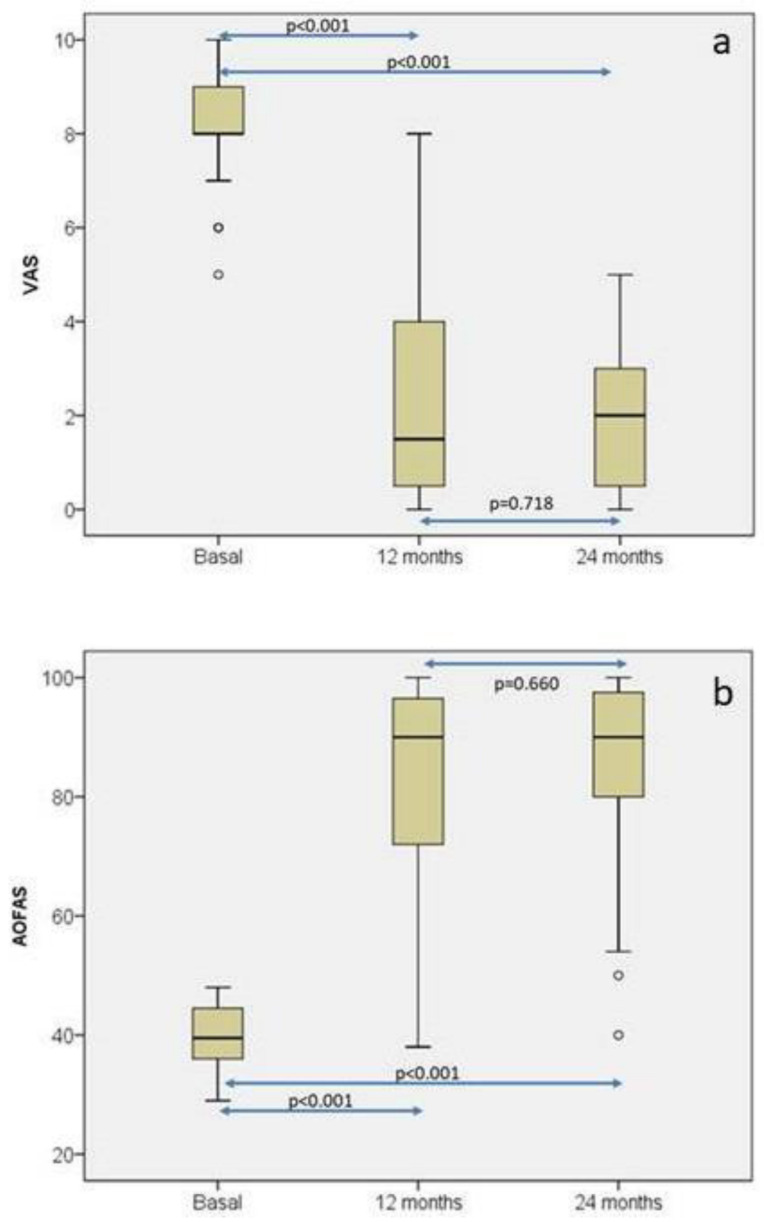
Figure 6.
Box plot representations of the distributions of the visual analogue scale (VAS) (a) and the American Orthopedic Foot and Ankle Society (AOFAS) ankle-hindfoot score (b) at baseline, 12-month, and 24-month follow-up. Each symbol ◦ represents an outlier (data point that significantly deviates from the majority of other data points. The figure highlights statistically significant differences in both parameters across the different time points [36].

