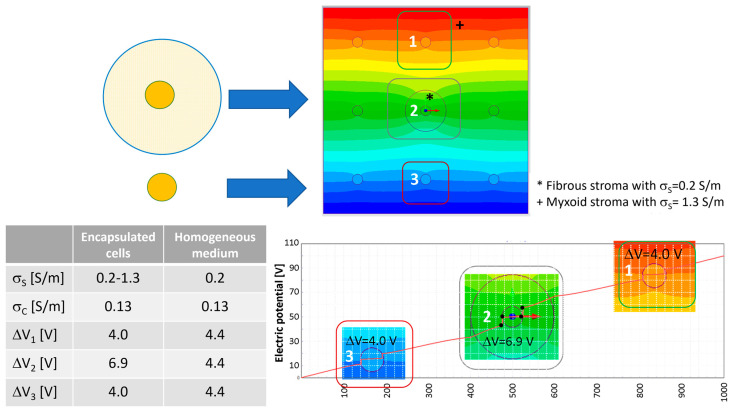
Figure 4.
Electric potential map in the nine-cell group with a local cell density of nine cells/mm2 (cell–cell distance 283 μm, cell diameter 50 μm) and transmembrane potential for the cell surrounded by the fibrous shell without shell with a diameter of 200 μm. The number 1–3 represents the cells for which the transmembrane potential is evaluated.

