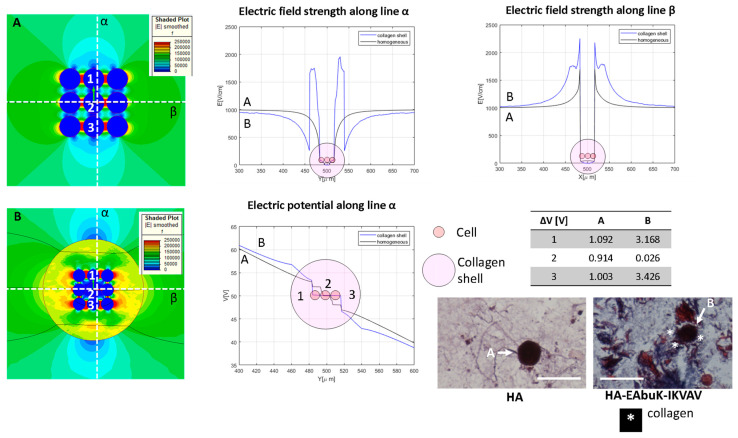
Figure 7.
Color map of electric field intensity for the spheroid case with (A) no collagen shell, case M in Table 1, and (B) collagen shell around the nine-cell group. Electric field and electrical potential sampled along line α and electric field along line β. Representative of the histological images (Masson trichrome staining) of the HA-only and HA-EAbuK-IKVAV HCC1954 cultures. Table reports transmembrane potential along line α. The number 1–3 represents the cells for which the transmembrane potential is evaluated.

