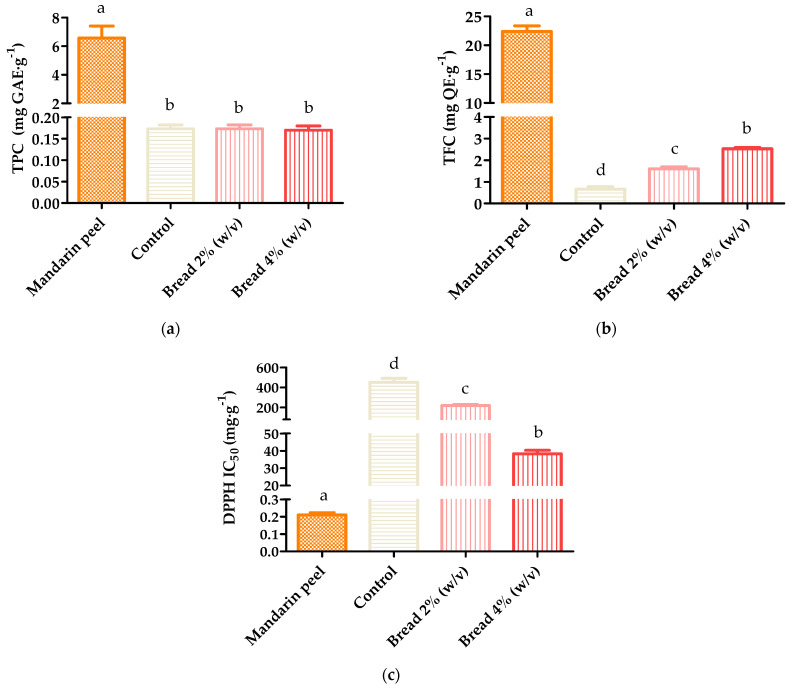
Figure 2.
Spectrophotometric determinations of phenolic extracts of mandarin peel, control bread, and enriched bread at 2% (w/v) and 4%(w/v): (a) total phenolic content; (b) total flavonoid content; (c) DPPH antioxidant activity. Data with different letters are significantly different at p−value < 0.05, according to one-way ANOVA and Fisher’s LSD test.

