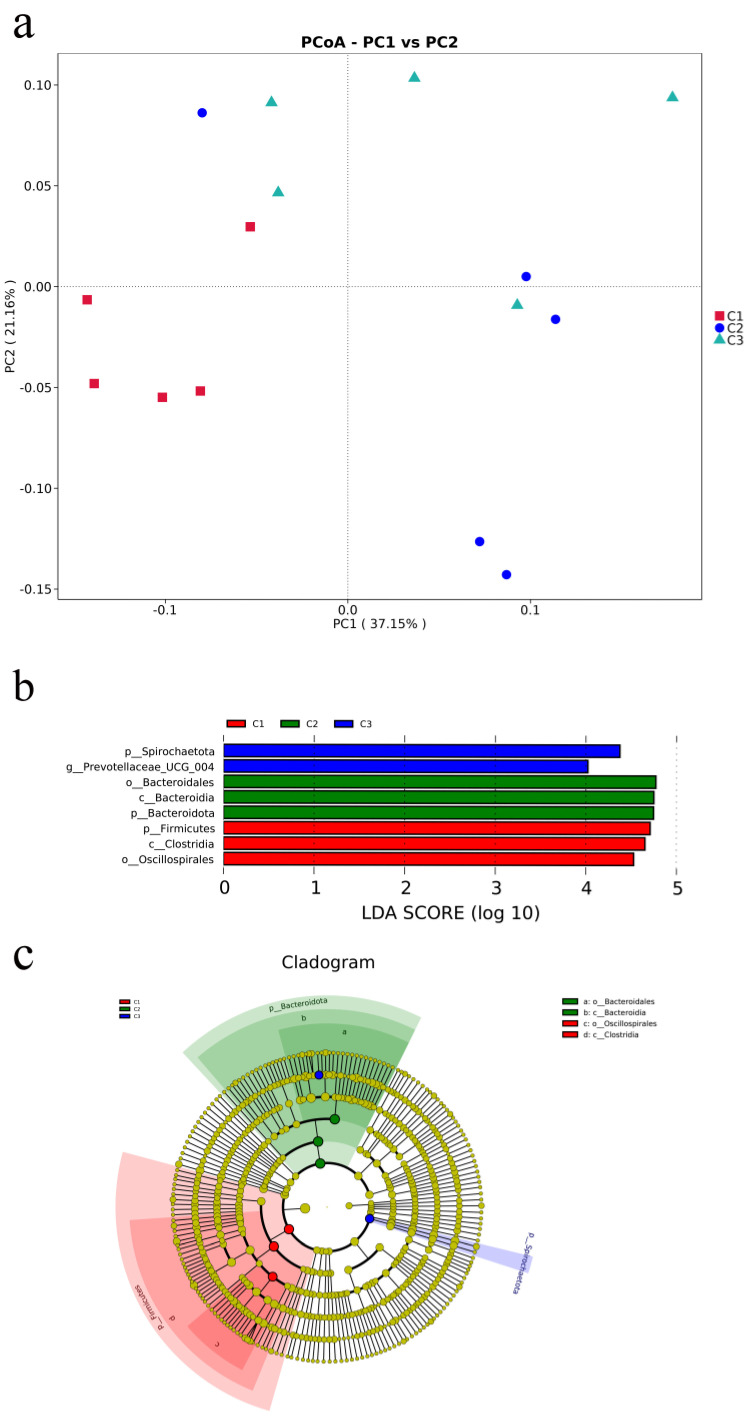
Figure 2.
Microbial community analysis of fecal microbiota. (a) Principal coordinates analysis (PCoA) was carried out based on weighted−unifrac distances with p−values of anosim to highlight the differences in the fecal microbiota communities of the three groups. (b) Linear discriminant analysis (LDA) value−distributed histogram, only taxa meeting an LDA significant threshold > 4 are shown. (c) Cladogram constructed to visualize the microbial community relative abundance data of the three groups.

