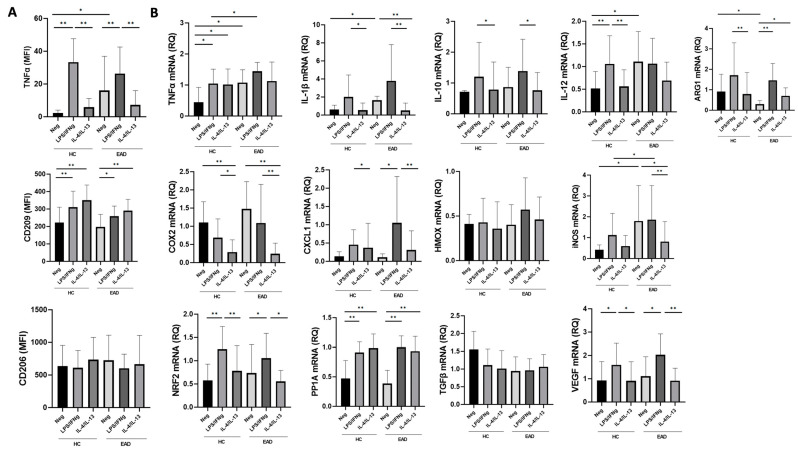
Figure 2.
Expression of M1/M2 surface markers and relative expression of mRNA in blood CD14+ monocytes after short-term culture. (A) Surface expression of tumor necrosis factor (TNF)-a, CD209, and CD206 in peripheral blood CD14+ monocytes from healthy controls (HCs) and excessive alcohol drinkers (EADs) following short-term incubation without any stimulant/negative control (Neg), and with interferon (IFN)-γ plus lipopolysaccharide (LPS), or interleukin (IL)-4 plus IL-13. Results are expressed as mean fluorescence intensity (relative arbitrary units of fluorescence). (B) Relative mRNA expression in blood CD14+ monocytes from HCs and EADs following short-term stimulation with IFN-γ plus LPS or IL-4 plus IL-13. Results are presented as fold-changes relative to the control group. For both panels, data are shown as the mean (standard deviation). * p < 0.05, ** p < 0.01 by Kruskal–Wallis test with Dunn’s post hoc test. MFI: mean fluorescence intensity. RQ: Relative quantification.

