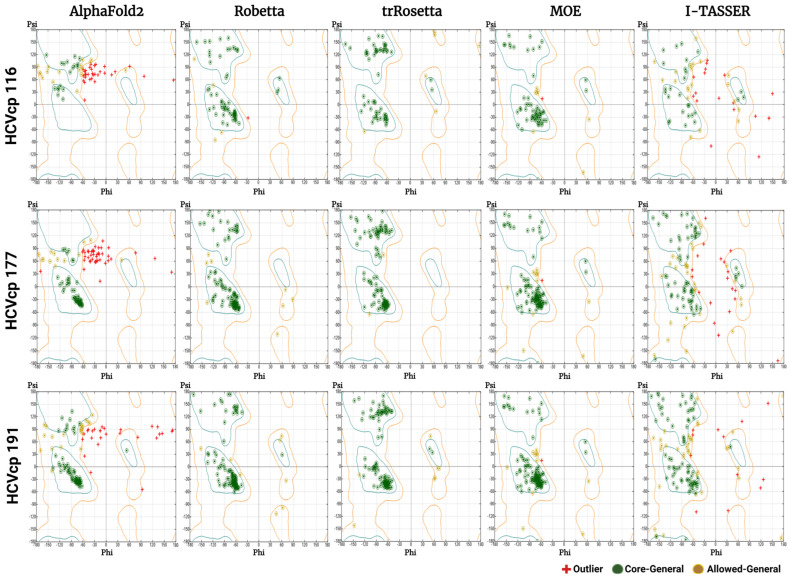
Figure 4.
Phi–psi plots for the HCVcp 116, HCVcp 177, and HCVcp 191 models constructed using AF2, Robetta, trRosetta, MOE, and I-TASSER. The cyan outline corresponds to most favored regions (conformations with no steric hindrance). The orange outline corresponds to allowed regions. The regions outside the orange outline are disallowed regions (sterically forbidden regions).

