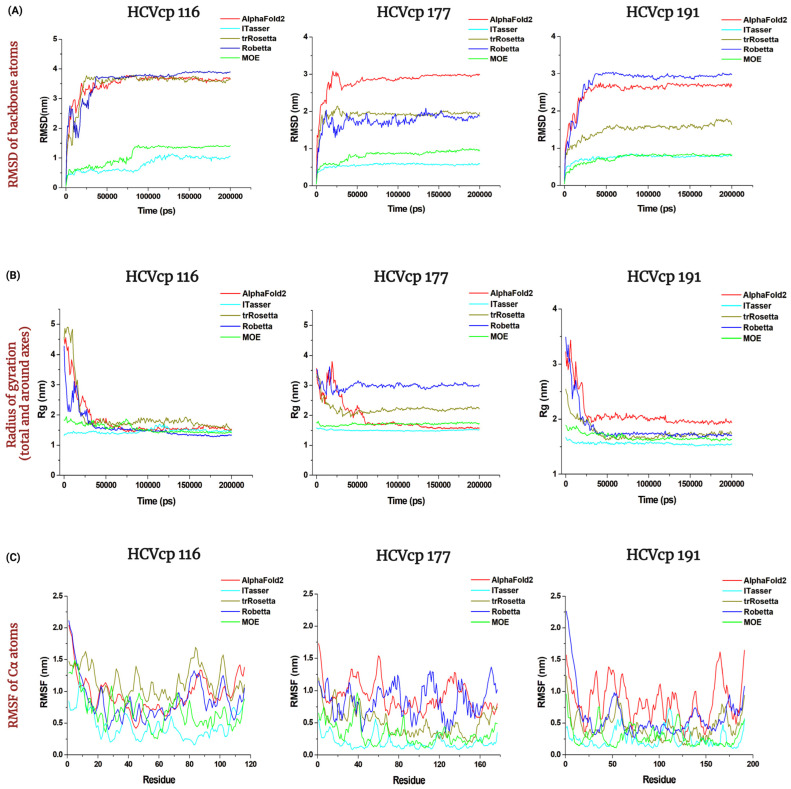
Figure 6.
MD simulation trajectories of (A) RMSD of backbone atoms, (B) radius of gyration, and (C) RMSF of Cα atoms for the models of HCVcp 116, HCVcp 177, and HCVcp 191 during the 200 ns MD simulations. The red, blue, dark yellow, green, and cyan lines indicate the values for the models constructed using AF2, Robetta, trRosetta, MOE, and I-TASSER, respectively.

