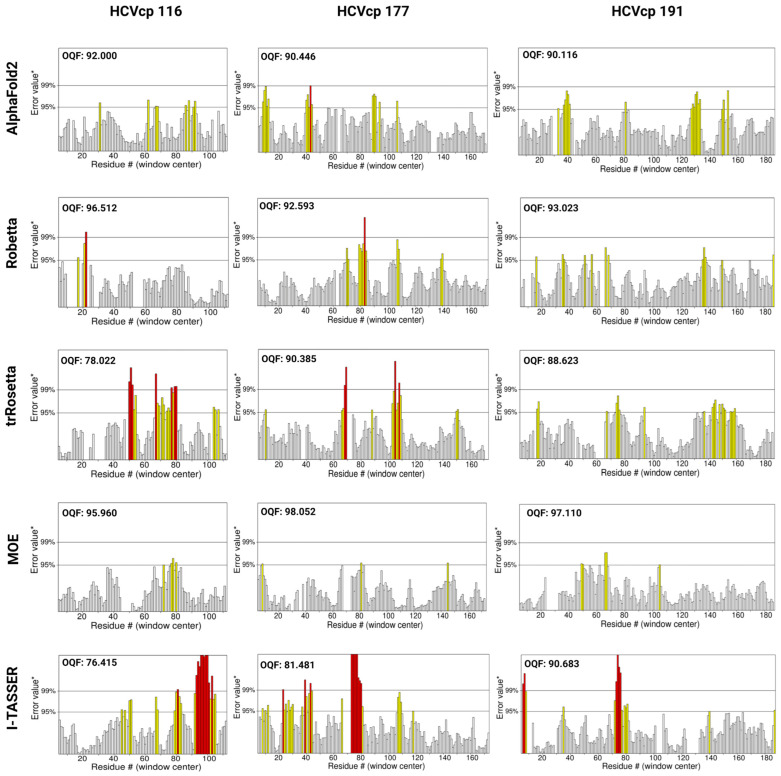
Figure 7.
ERRAT plots for the refined HCVcp 116, HCVcp 177, and HCVcp 191 models. The models were predicted using AF2, Robetta, trRosetta, MOE, and I-TASSER and subsequently subjected to 200 ns MD simulations. The plots show two lines (on the error axis), which indicate the confidence level at which regions exceeding the error value can be rejected. The regions that can be rejected at the 95% confidence level are in yellow, whereas those that can be rejected at the 99% confidence level (99% confidence in being erroneous) are in red. OQF, overall quality factor.

