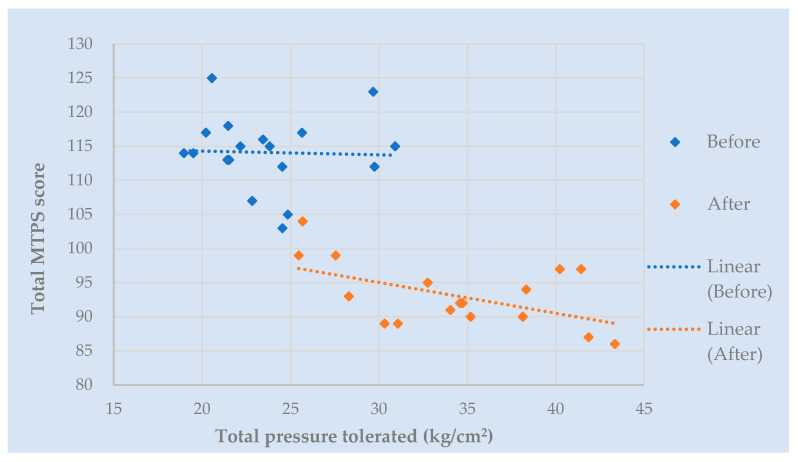
Figure 8.
Manual Tender Point Survey score (y-axis) versus pressure tolerated (x-axis), representing an average score for tender point across anatomical location. Each diamond represents one of the 18 anatomical locations. y-axis demonstrates total sum of MTPS (Manual Tender Point Survey) scores for each tender point. x-axis shows total pressure tolerated for each tender point. Blue diamonds represent scores for each tender point pre-treatment. Red diamonds represent scores post-treatment. Dotted lines depict correlations.

