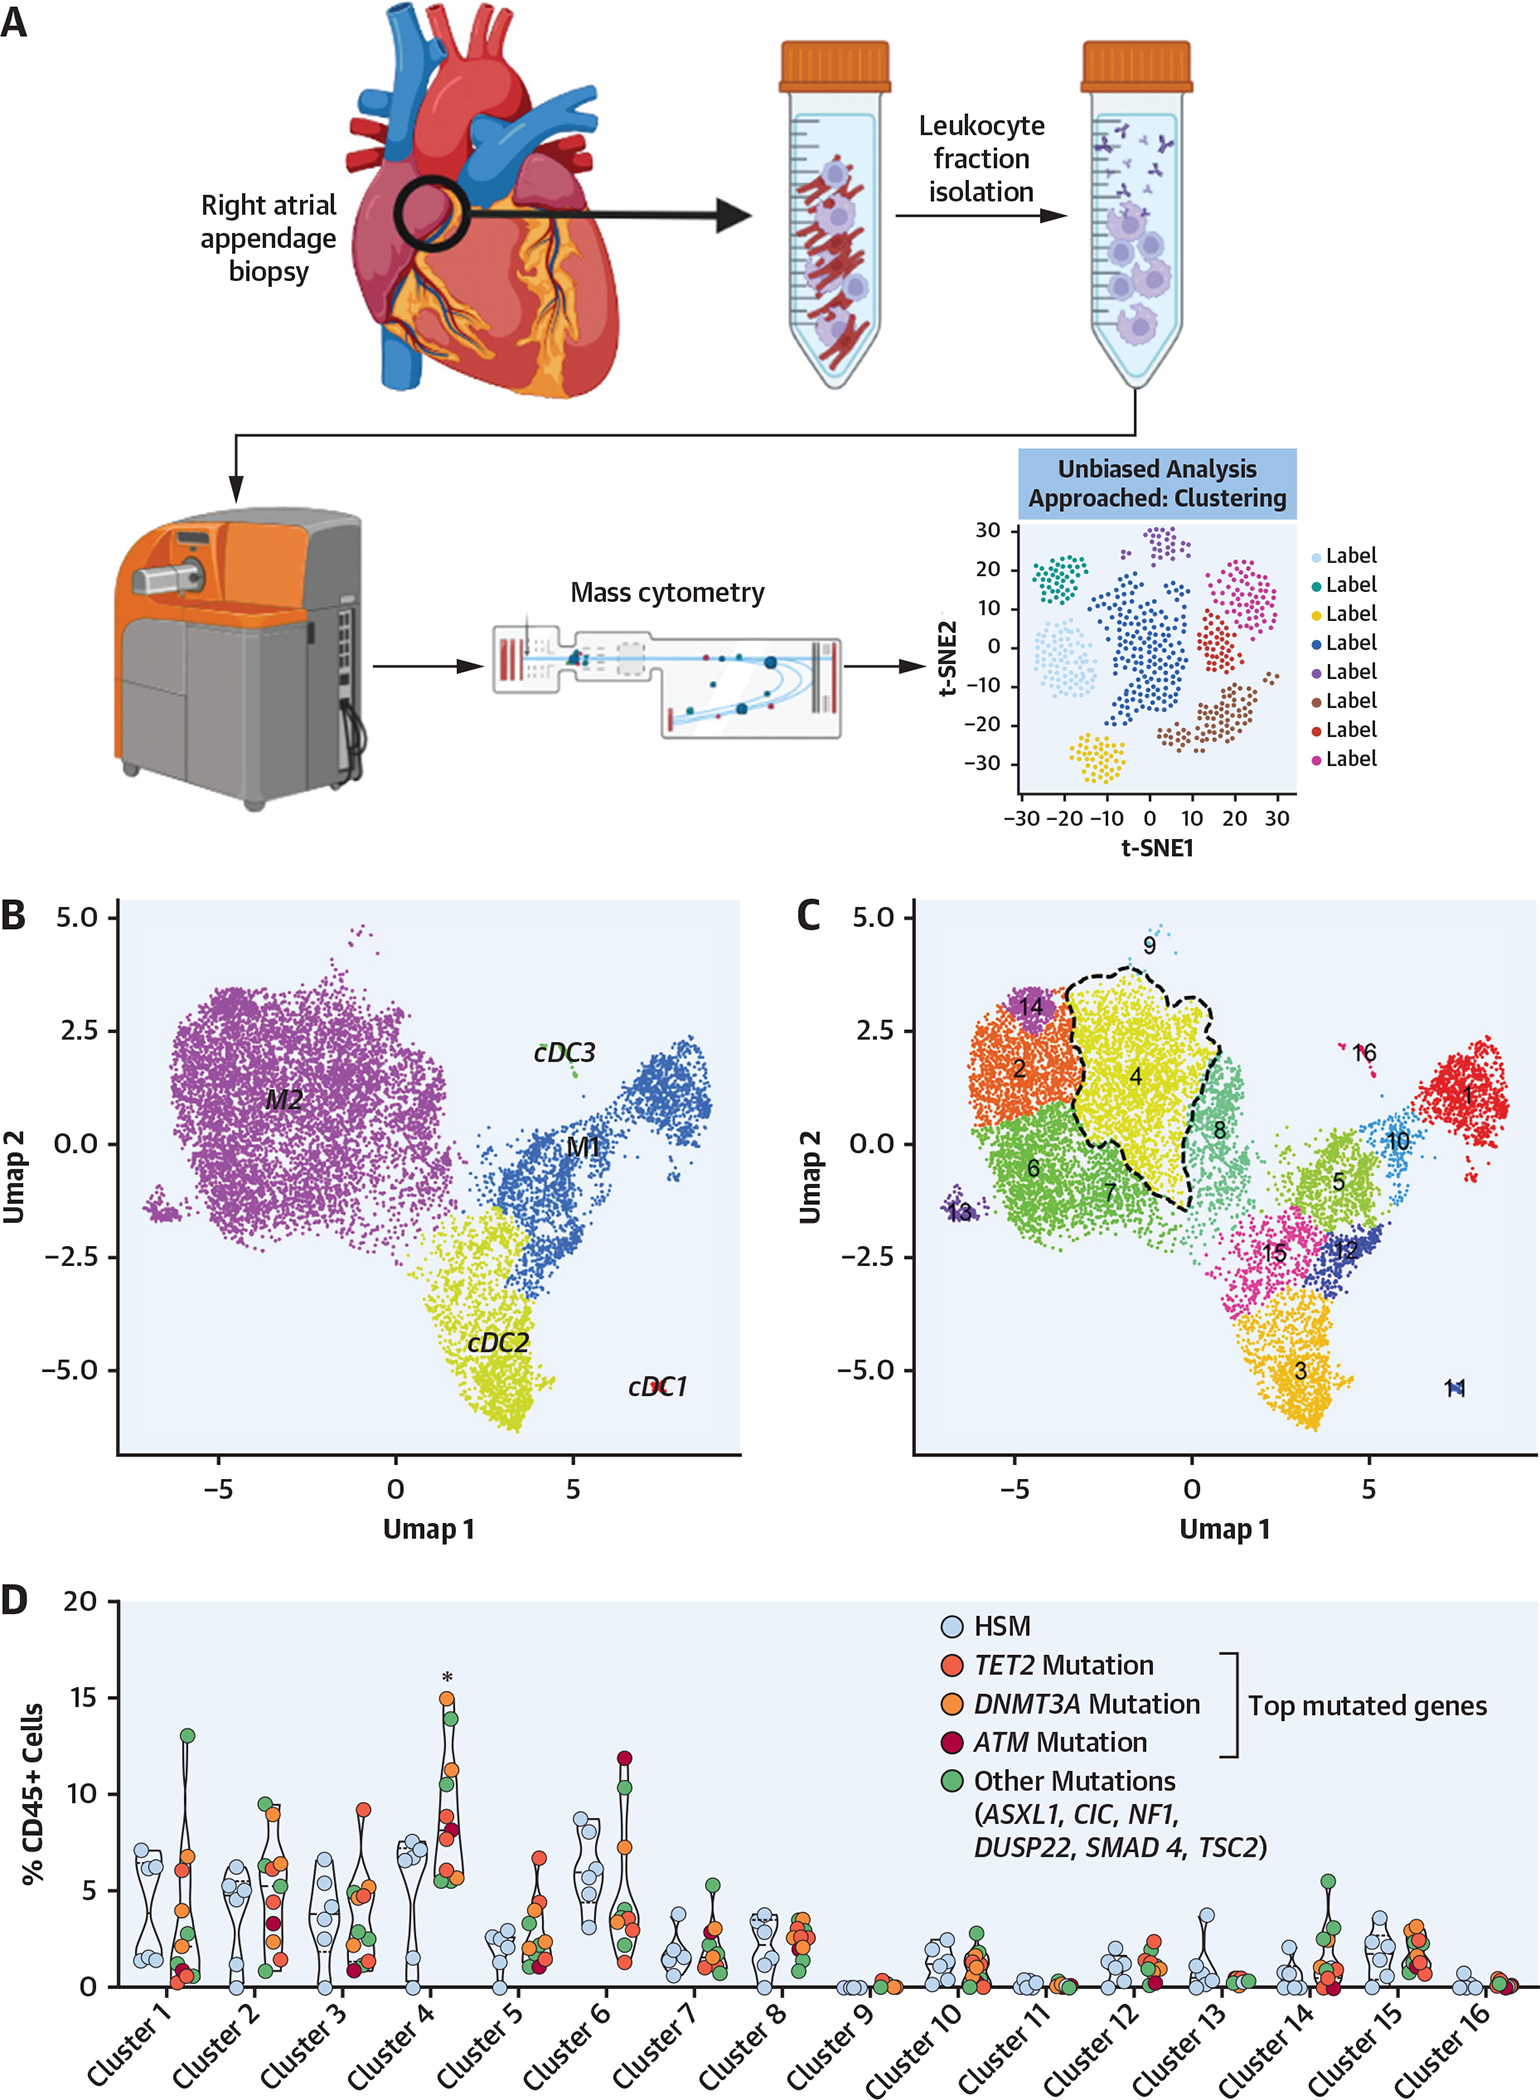
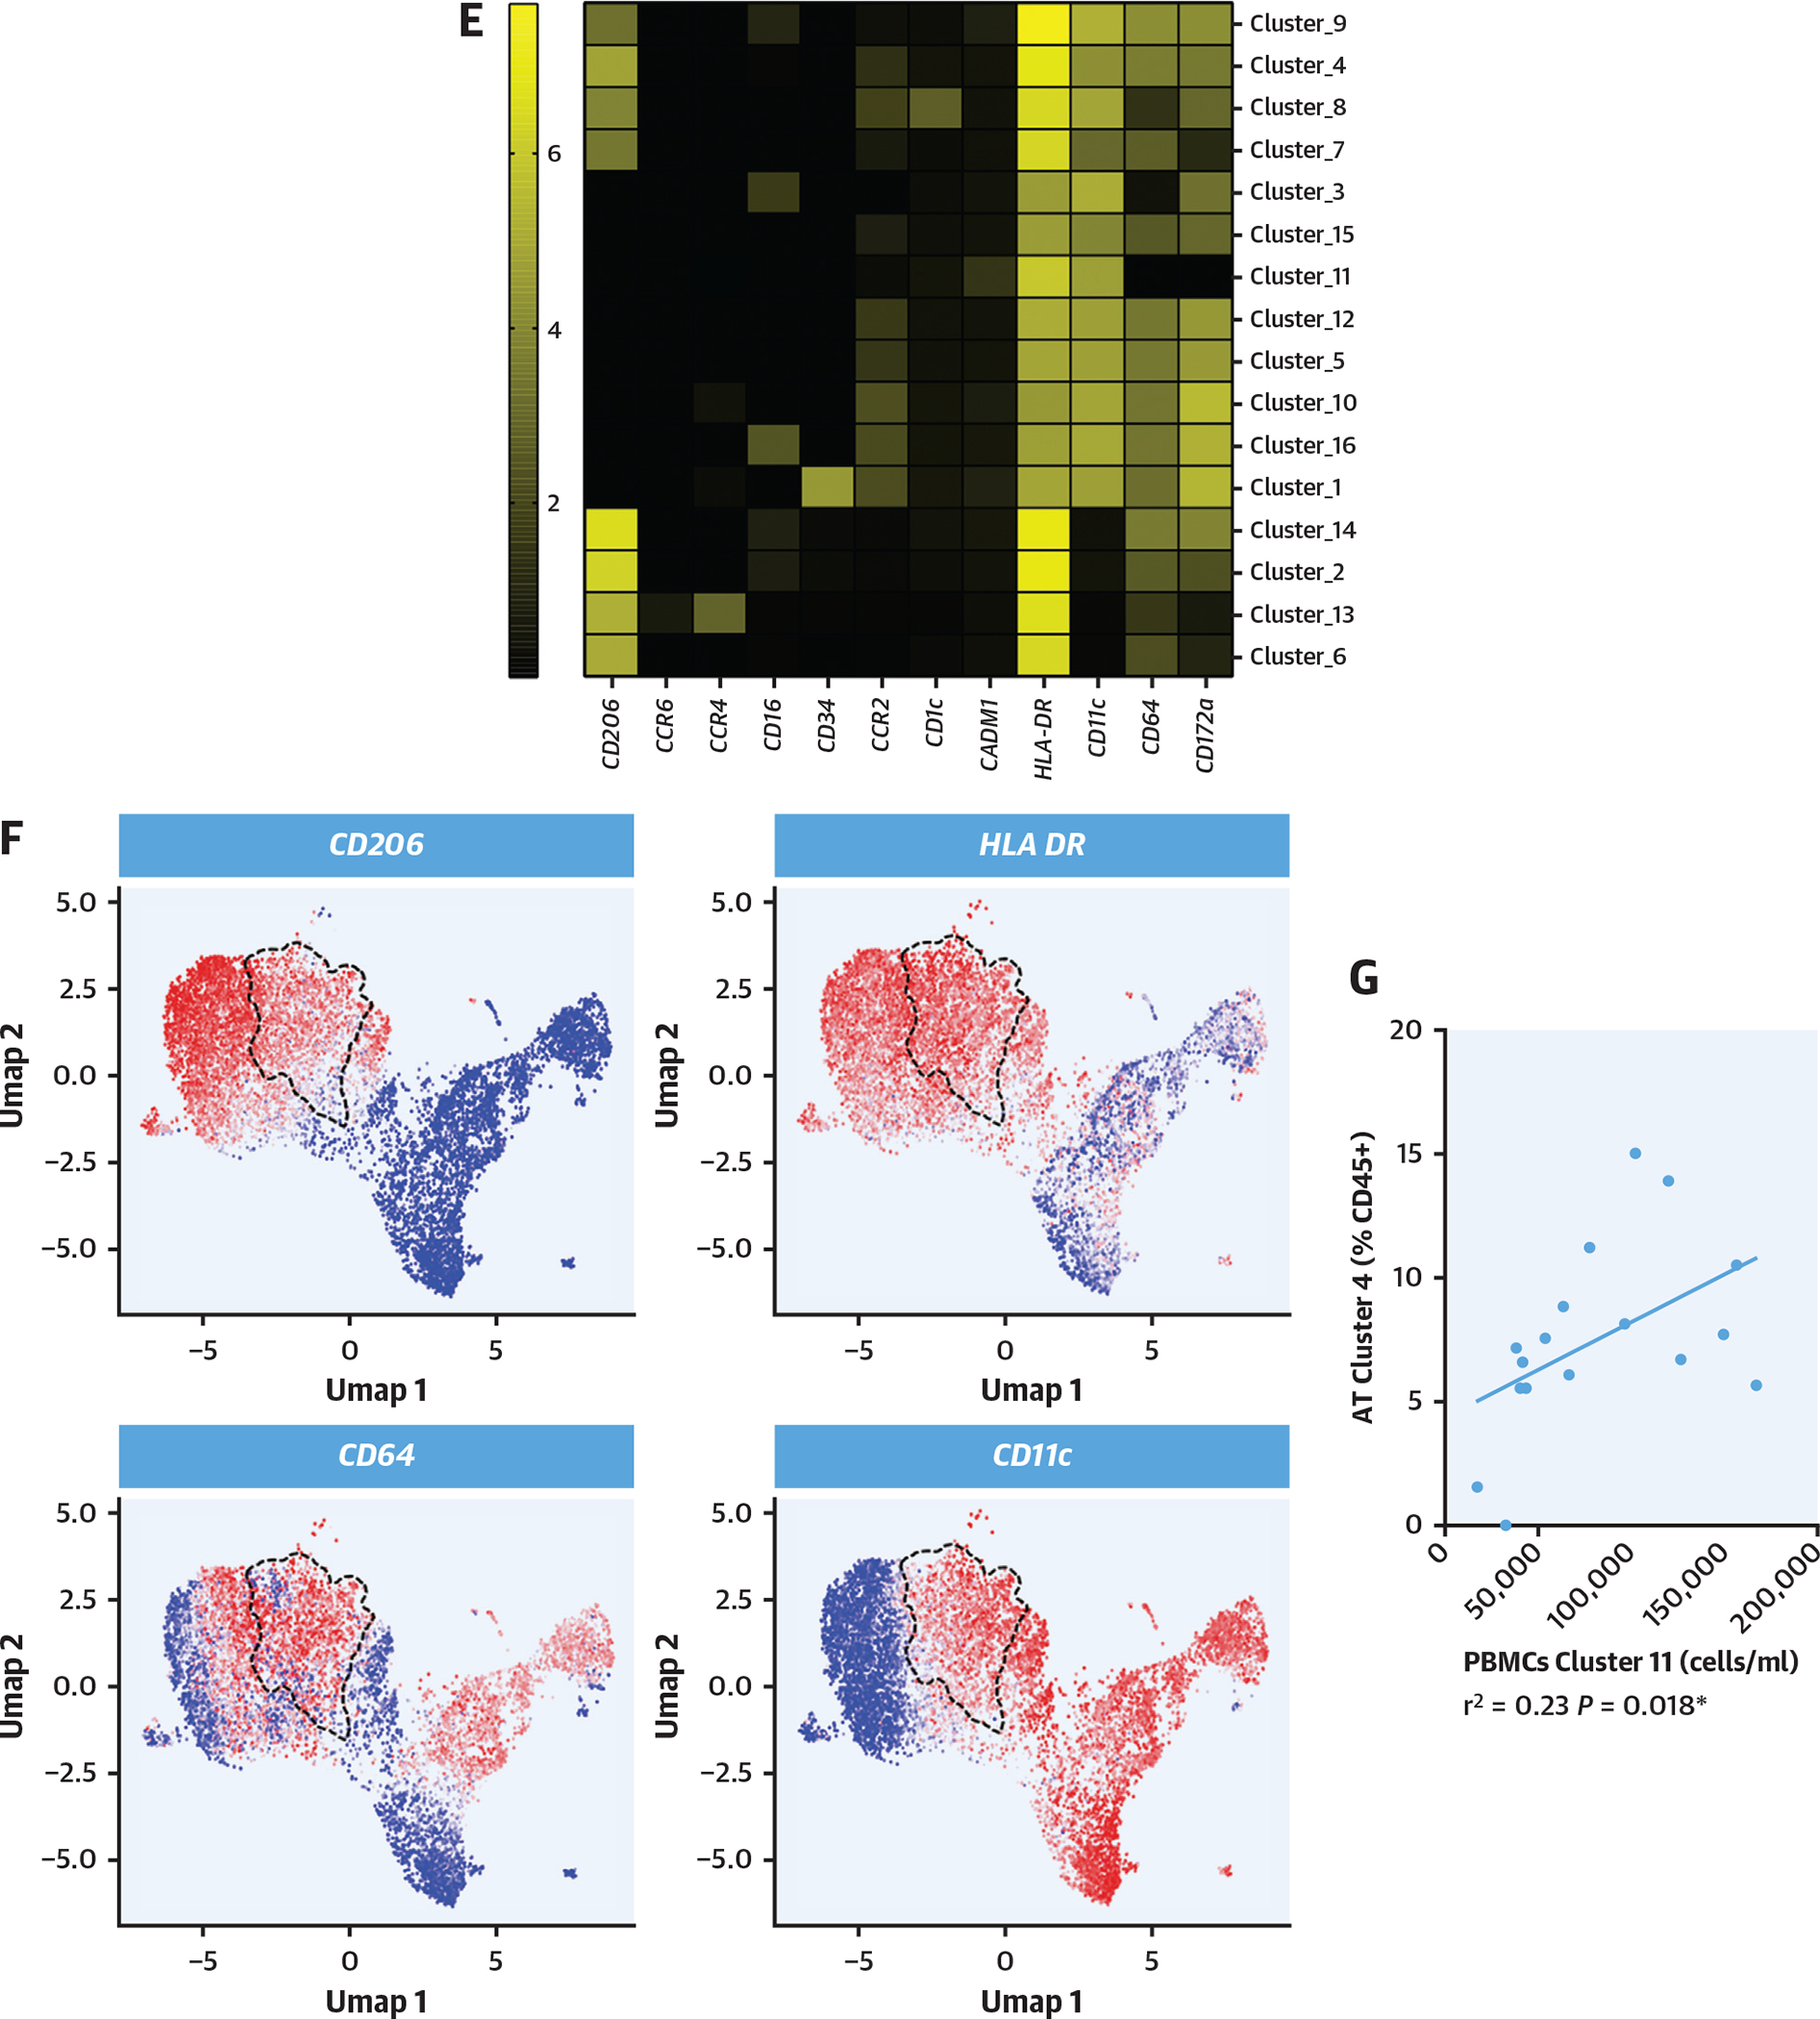
FIGURE 4. Myocardial Immune Phenotype According to HSM Status.


(A) Right appendage biopsies were collected from 17 patients, and leukocyte fraction was isolated and characterized using mass cytometry with unbiased approach on the basis of clustering. (B, C) Unsupervised clustering map of myeloid cells with general populations (top) and16 clusters (bottom) reidentified. (D) Heatmap representing characteristics of each identified cluster regarding the intensity of each marker. (E) Violin plots representing the proportion of each cluster among the total CD45+ cells in myocardium according to HSM status. Computations assumed the same scatter for subsets (*cluster 4: 4.9% ± 3.2% vs 8.5% ± 3.4% of CD45+ cells, FDR < 0.001). (F) Relative expression of markers defining cluster 4 in the map. Dashed line represents cluster 4 on each map. (G) Correlation between atrial tissue (AT) cluster 4 and peripheral blood mononuclear cell (PBMC) cluster 11 (monocytes) up-regulated in patients with HSM. HSM was defined according to the HemePACT panel with VAF ≥1%. t-SNE = t-distributed stochastic neighbor embedding; Umap = uniform manifold approximation and projection; other abbreviations as in Figures 1 and 2.
