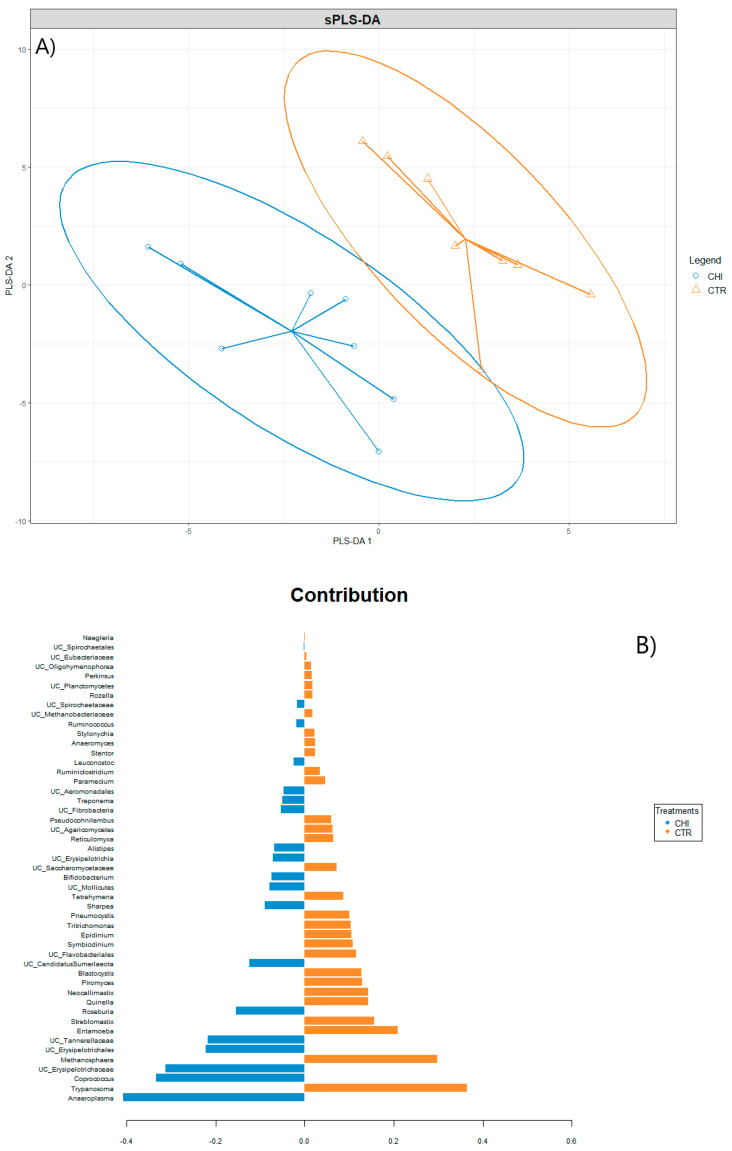
Figure 2.
(A) Sample plots from Sparse Partial Least Squares Discriminant Analysis (SPLS-DA) performed on the data at genus level, including 95% confidence ellipses. Samples are projected into the space spanned by the first two components. Samples are colored by their experimental group, CTR (control) or CHI (chitosan), and (B) shows the features selected by the SPLS-DA algorithm as most predictive or discriminative features in the data to classify the samples and represent the contribution of each feature selected on the first (30) and second component (19), respectively, with contribution ranked from bottom (important) to top. Colors in the contribution plot indicate the experimental group with the highest median for each selected feature labelled at the genus level. The negative (resp. positive) sign on the x-axis represents the regression coefficient weight of each feature in the linear combination of the sPLS-DA component.

