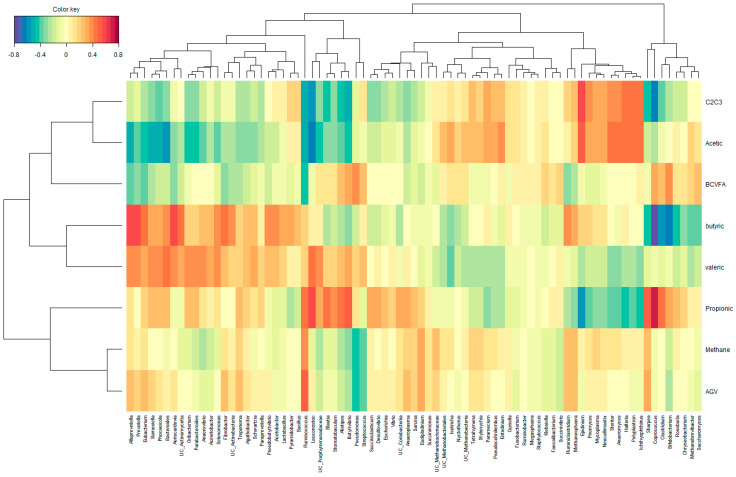
Figure 3.
Relationships between clusters of microbial genus and ruminal volatile fatty acids and enteric methane concentration in eructated air, independently of experimental group. This clustered image map was based on the regularized canonical correlations between relative microbial abundances after CLR normalization and relative concentrations of rumen short chain fatty acids and methane concentration data. Significant correlations are colored following the key shown.

