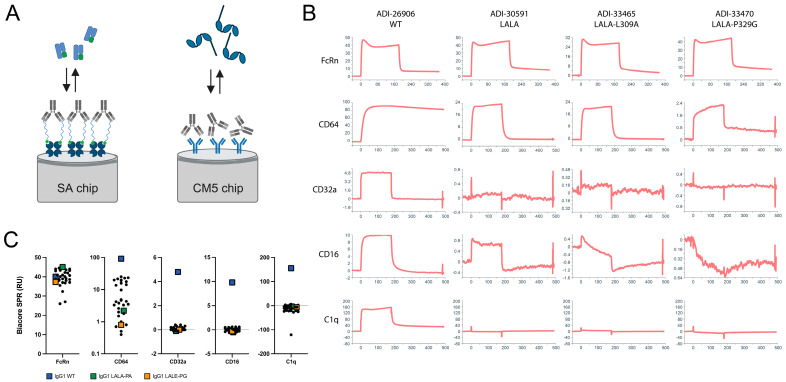
Figure 2.
Profiling binding of IgG1 WT and variants to FcRn, CD64 (FcγRI), CD32a (FcγRII), CD16 (FcγRIII), and C1q by Biacore SPR. (A) Schematic representation of assay format for FcRn, FcγR, and C1q, created with BioRender. (B) Representative Biacore SPR sensograms. The Y-axis range is floated to show details of the association and dissociation phases. (C) Grouped dot plots of SPR response units for the panel of hinge and CH2 mutant variants, with WT IgG1 indicated by the blue squares, IgG1 LALA-P329A indicated by the green squares, and IgG1 LALE-P329G indicated by the orange squares.

