Figure 1.
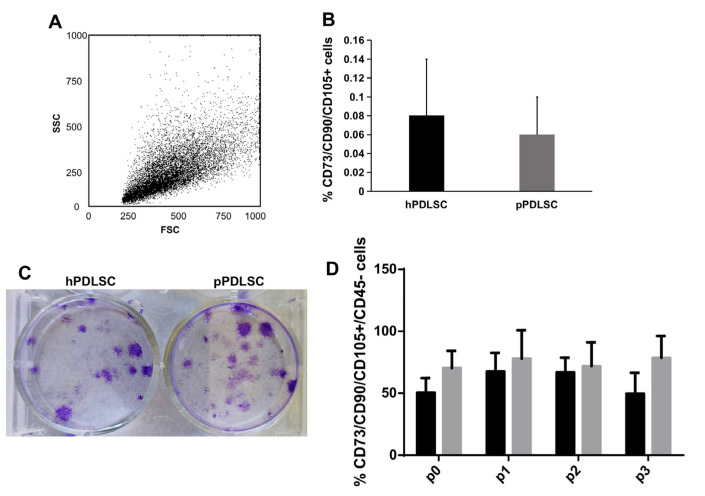
Analysis of PDLSCs after isolation. The dot plot shows the heterogeneous morphology of cells, soon after isolation from PDL (A), and the analysis of MSC markers showed their low expression in both hPDLSCs and pPDLSCs (B). Once plated both PDLSCs were able to form small colonies, stained by crystal violet (C). The percentage of PDLSCs co-expressing CD73, CD90, CD105, was negative for CD45 and was stable and comparable between hPDLSCs and pPDLSCs until p2, then it was significantly higher in pPDLSCs at p3, p < 0.05 (D).

