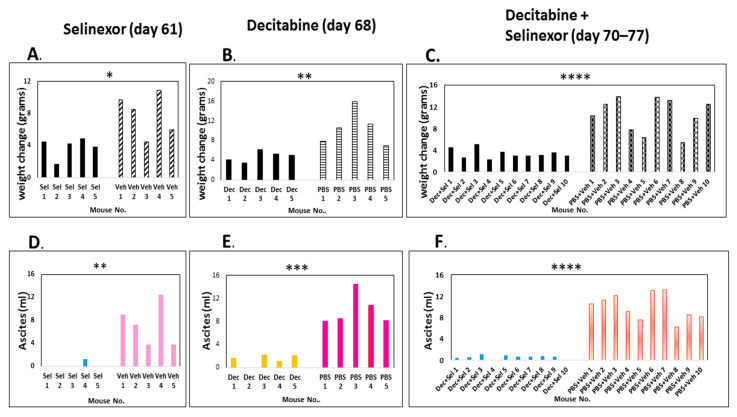
Figure 2.
Regulation of weights and ascites development in mice with decitabine and selinexor treatment. Mice were administered ID8-RFP cells, 8 doses of decitabine and 6 doses of selinexor, as described in Figure 1A. Differences in weight as measured at time before any treatments were administered and the day of euthanasia for each treatment group are shown for panels (A): selinexor vs. vehicle (p ≤ 0.05 *), (B): decitabine vs. PBS (p ≤ 0.01 **) and (C): combination decitabine and selinexor vs. PBS and vehicle (p < 0.0001 ****). The volume of ascites recovered from mice is shown in panels (D): selinexor vs. vehicle (p ≤ 0.01 **), (E): decitabine vs. PBS (p ≤ 0.001 ***) and (F): combination decitabine and selinexor vs. PBS and vehicle (p ≤ 0.0001 ****). All statistics were completed with a two-sample t test except for (D) (selinexor ascites) where the normality assumption was not met, and the analysis was completed using the Wilcoxon rank sum test. Abbreviations: selinexor; sel. decitabine; dec.

