Figure 4.
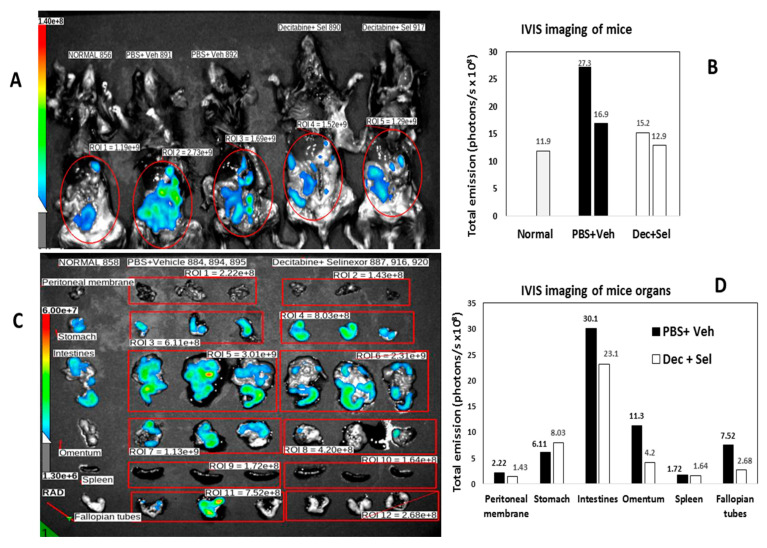
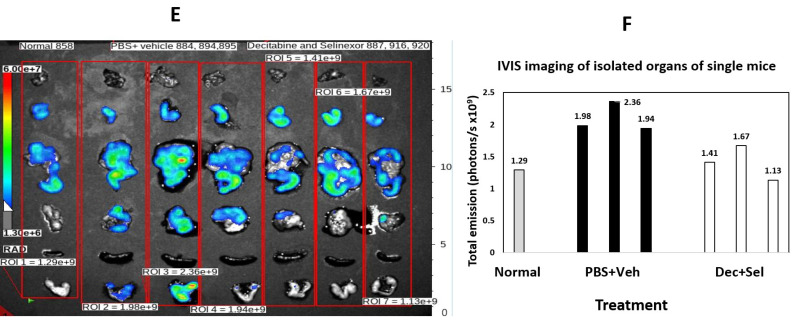
IVIS imaging of mice. In panel (A), B6 mice were administered ID8-RFP tumor cells. Mice were treated with 8 doses of decitabine and 6 doses of selinexor (I.D. 890, 917) in combination or with PBS and vehicle (I.D. 891, 892), as shown in Figure 1A. Mice were euthanized at day 74 post-ID8-RFP tumor cell inoculation, abdomens were opened and imaged on an IVIS spectrum. ROIs were selected and total emission (radiance) in photons/s measured. The far-left column shows lowest fluorescence in an unmanipulated B6 mouse. Panel (B) is a bar graph plot of total emission in the ROIs of panel (A). Panel (C) shows imaging of combination-treated mice. B6 mice were administered ID8-RFP tumor cells. Mice (n = 3/group) were treated with decitabine and selinexor combination (I.D. 887, 916, 920) or with PBS and vehicle (I.D. 884, 894, 895). At the time of euthanasia, organs were removed and imaged on an IVIS Spectrum. Regions of interest (ROIs) were selected across the organs of 3 mice of the same treatment together and total emission measured in photons/s where 6.00e+7 = 6 × 10⁷ photons/s. Panels indicate less fluorescence in treated mice than in control mice in intestines, omentum and fallopian tubes. Panel (D) is a bar graph plot of Panel (C) photons/s measurements. For example, peritoneal membrane of PBS+ vehicle-treated mouse is the value for ROI 1 and fallopian tubes of decitabine + selinexor-treated mice are ROI 12 in the bar graph. Panel (E). Mice were treated with ID8-RFP cells followed by decitabine and selinexor (I.D. 887, 916, 920) or with PBS and vehicle (I.D. 884, 894, 895). In Panel (F), regions of interest (ROIs) were selected to include organs of single mice as shown (n = 3 mice each treatment group as above). Photons/second values for an unmanipulated B6 mouse are also shown. Panel (F) are bar graph plots for ROI 1–7 from panel (E), where each bar represents all organs shown for one mouse.


