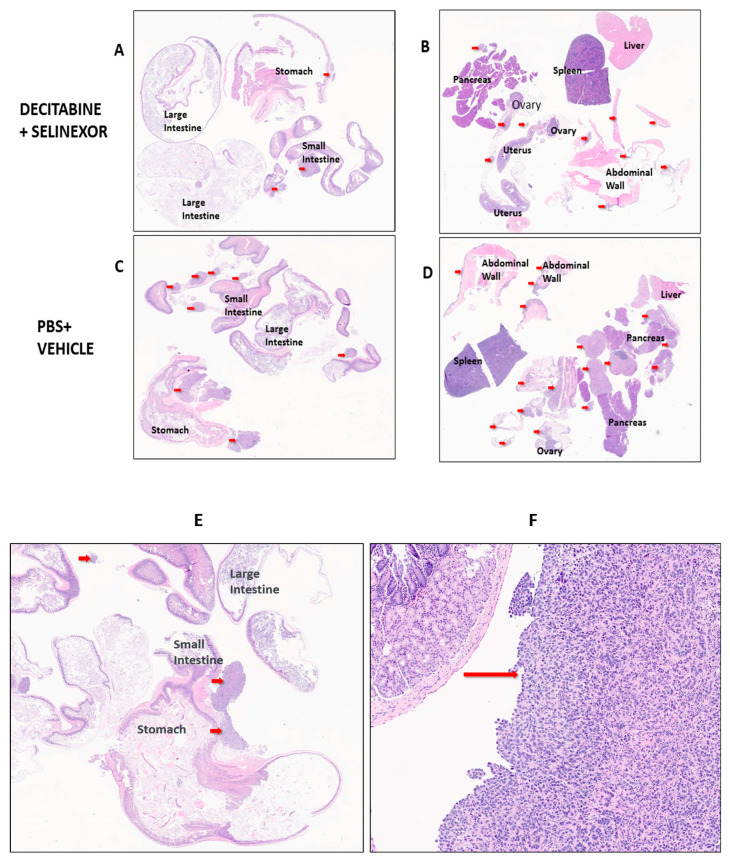
Figure 5.
Visualization of ovarian tumor foci in mice. Mice which received tumor cells were treated with 8 doses of decitabine and 6 doses of selinexor (as indicated in Figure 1A). At the time of euthanasia, tissue arrays of each mouse organs were constructed. Arrays were H and E stained and scanned for pathologist evaluation. Arrays shown are representative of tumors (red arrows) on organs of mice for each treatment group. Panels shown are for treatment groups: (A,B) combination decitabine and selinexor, (C,D)—PBS and vehicle controls. A similar pattern of tumor spread was found on organs for selinexor and vehicle and for decitabine and PBS mouse groups (Supplementary Figure S3A–H). A summary of these studies is shown in Table 1. Panels (E,F) show the alimentary tract tissue array with high-power inset of tumor in the small intestine.

