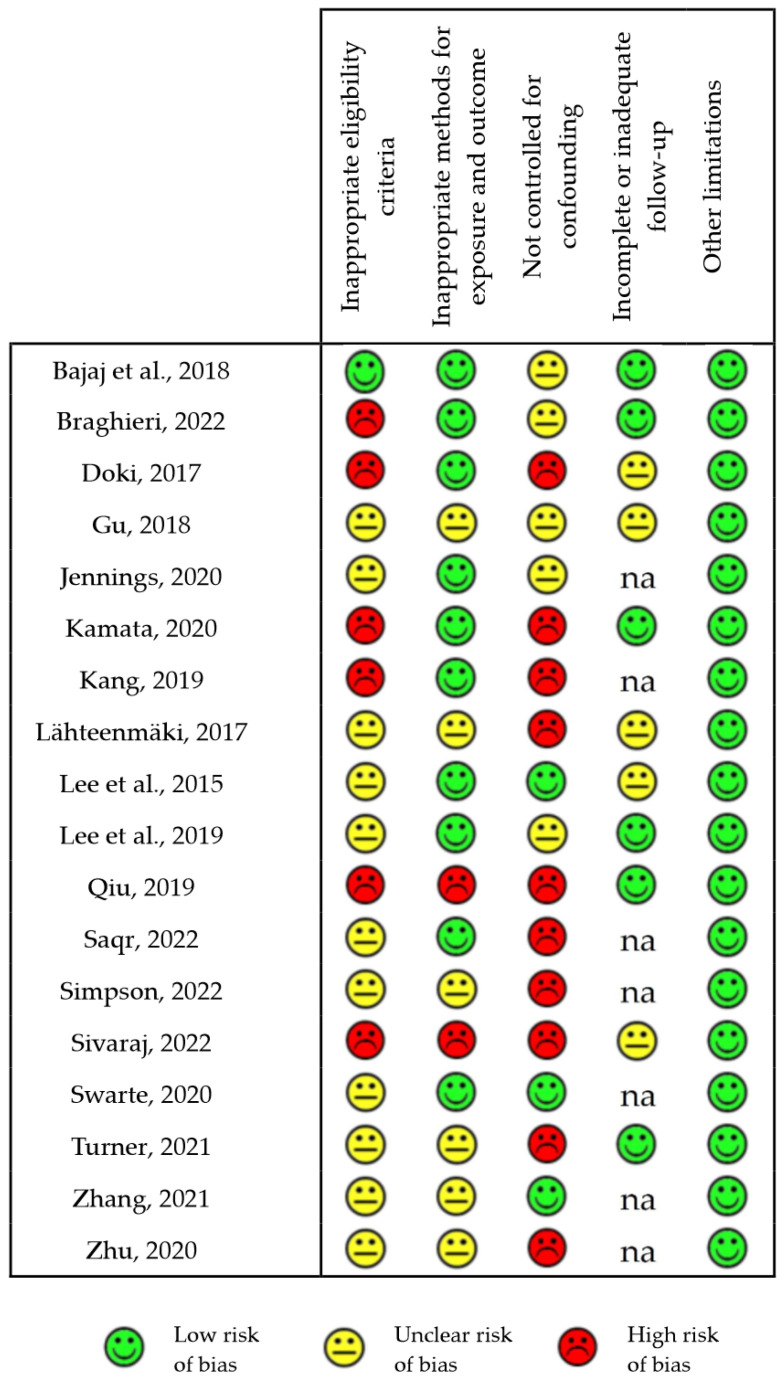
Figure 3.
Risk of bias of observational human studies [21,22,24,27,28,29,32,33,35,38,40,41,54,55,56,60,64,65]. The chart reports the risk of bias for each of the individually estimated GRADE categories in all the reviewed human observational studies and classified as “low”, “unclear” or “high”. na: not applicable.

