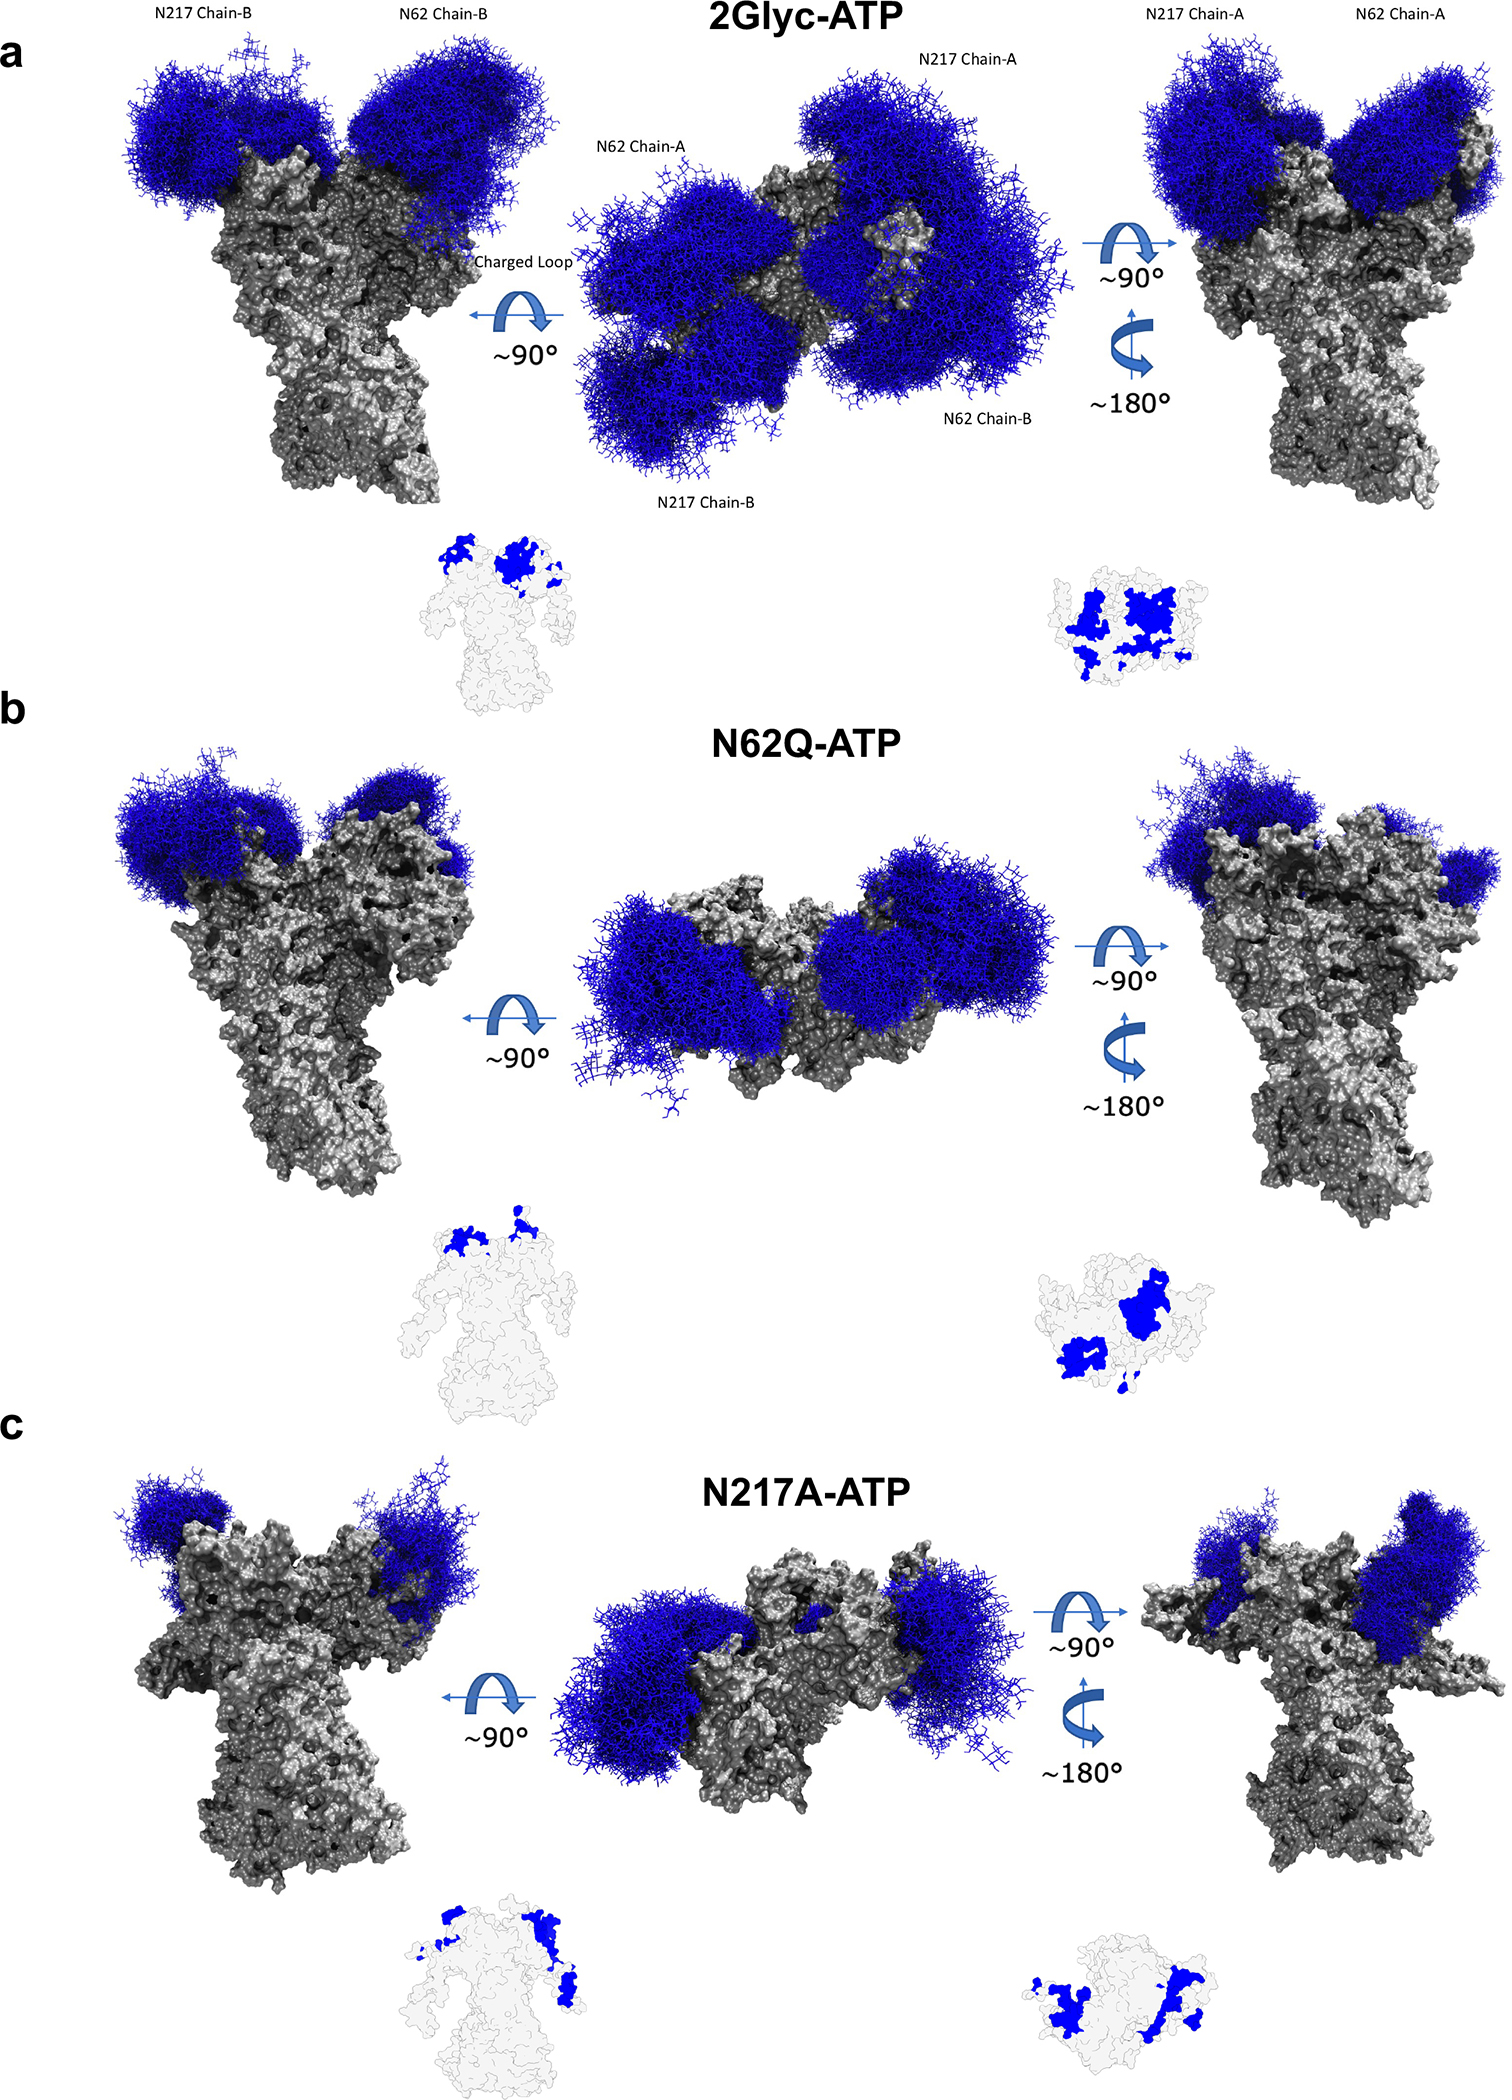
Figure 3. Glycan dynamics on the surfaces of GRP94.

(a) Molecular representation of the 2GlycATP system. Glycans at several frames (namely, 300 frames, one every 30 ns from one replica) are represented with blue lines, while the protein is shown as a gray surface.
(b) Same as a), for the N62Q mutant in complex with ATP; c) Same as a), for the N217A mutant in complex with ATP.
Insets: Analysis of accessible area for more than 70% of the simulation time; gray shading indicates the areas that are accessible for more than 70% of the simulation time; in blue the ones that are shielded by carbohydrates.
