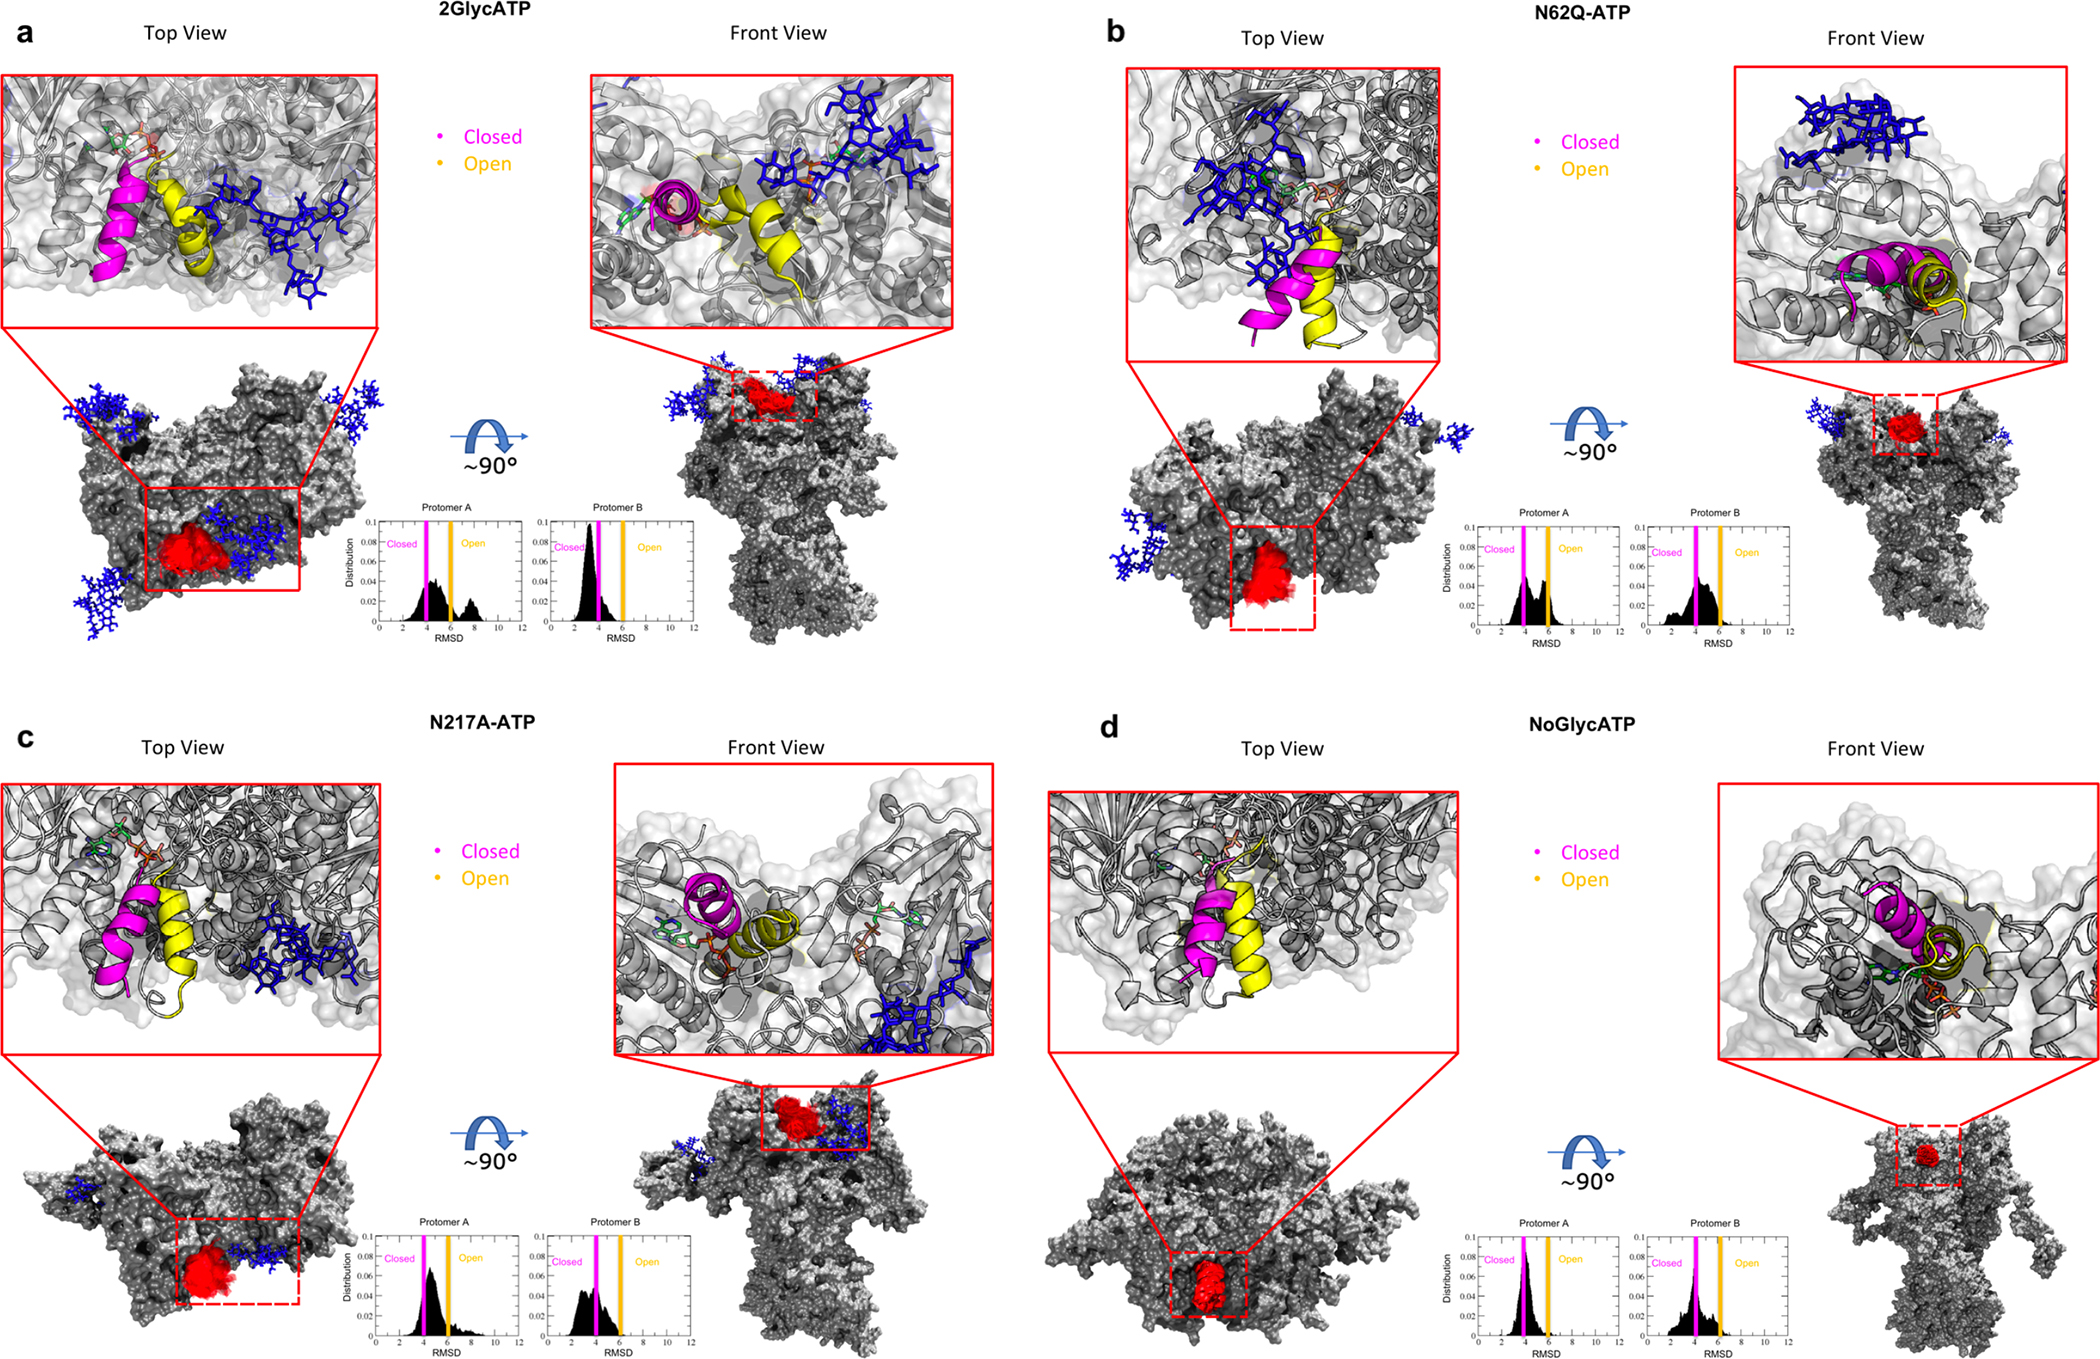
Figure 8. Conformational dynamics of the ATP-lid covering the active site of Grp94 and its interactions with sugar chains in the open or closed forms.

Two orientations are depicted. ATP-lid and glycans at several frames (300 frames) are represented with red and blue lines, respectively. The insets show the distributions of RMSD values from the conformation presented in crystal structure PDB 5ULS.pdb. The blue and yellow vertical lines show the RMSD threshold for the closed and open states, respectively.
(a) 2GlycATP.
(b) N62Q mutant in complex with ATP.
(c) N217A mutant in complex with ATP.
(d) NoGlyc system in complex with ATP.
