
Figure 2. Human Aortic Single Cell Transcription Profiling Reveals Elevated SETDB2 and Extracellular Matrix Organization Pathways in Infiltrating Monocyte/Macrophages.
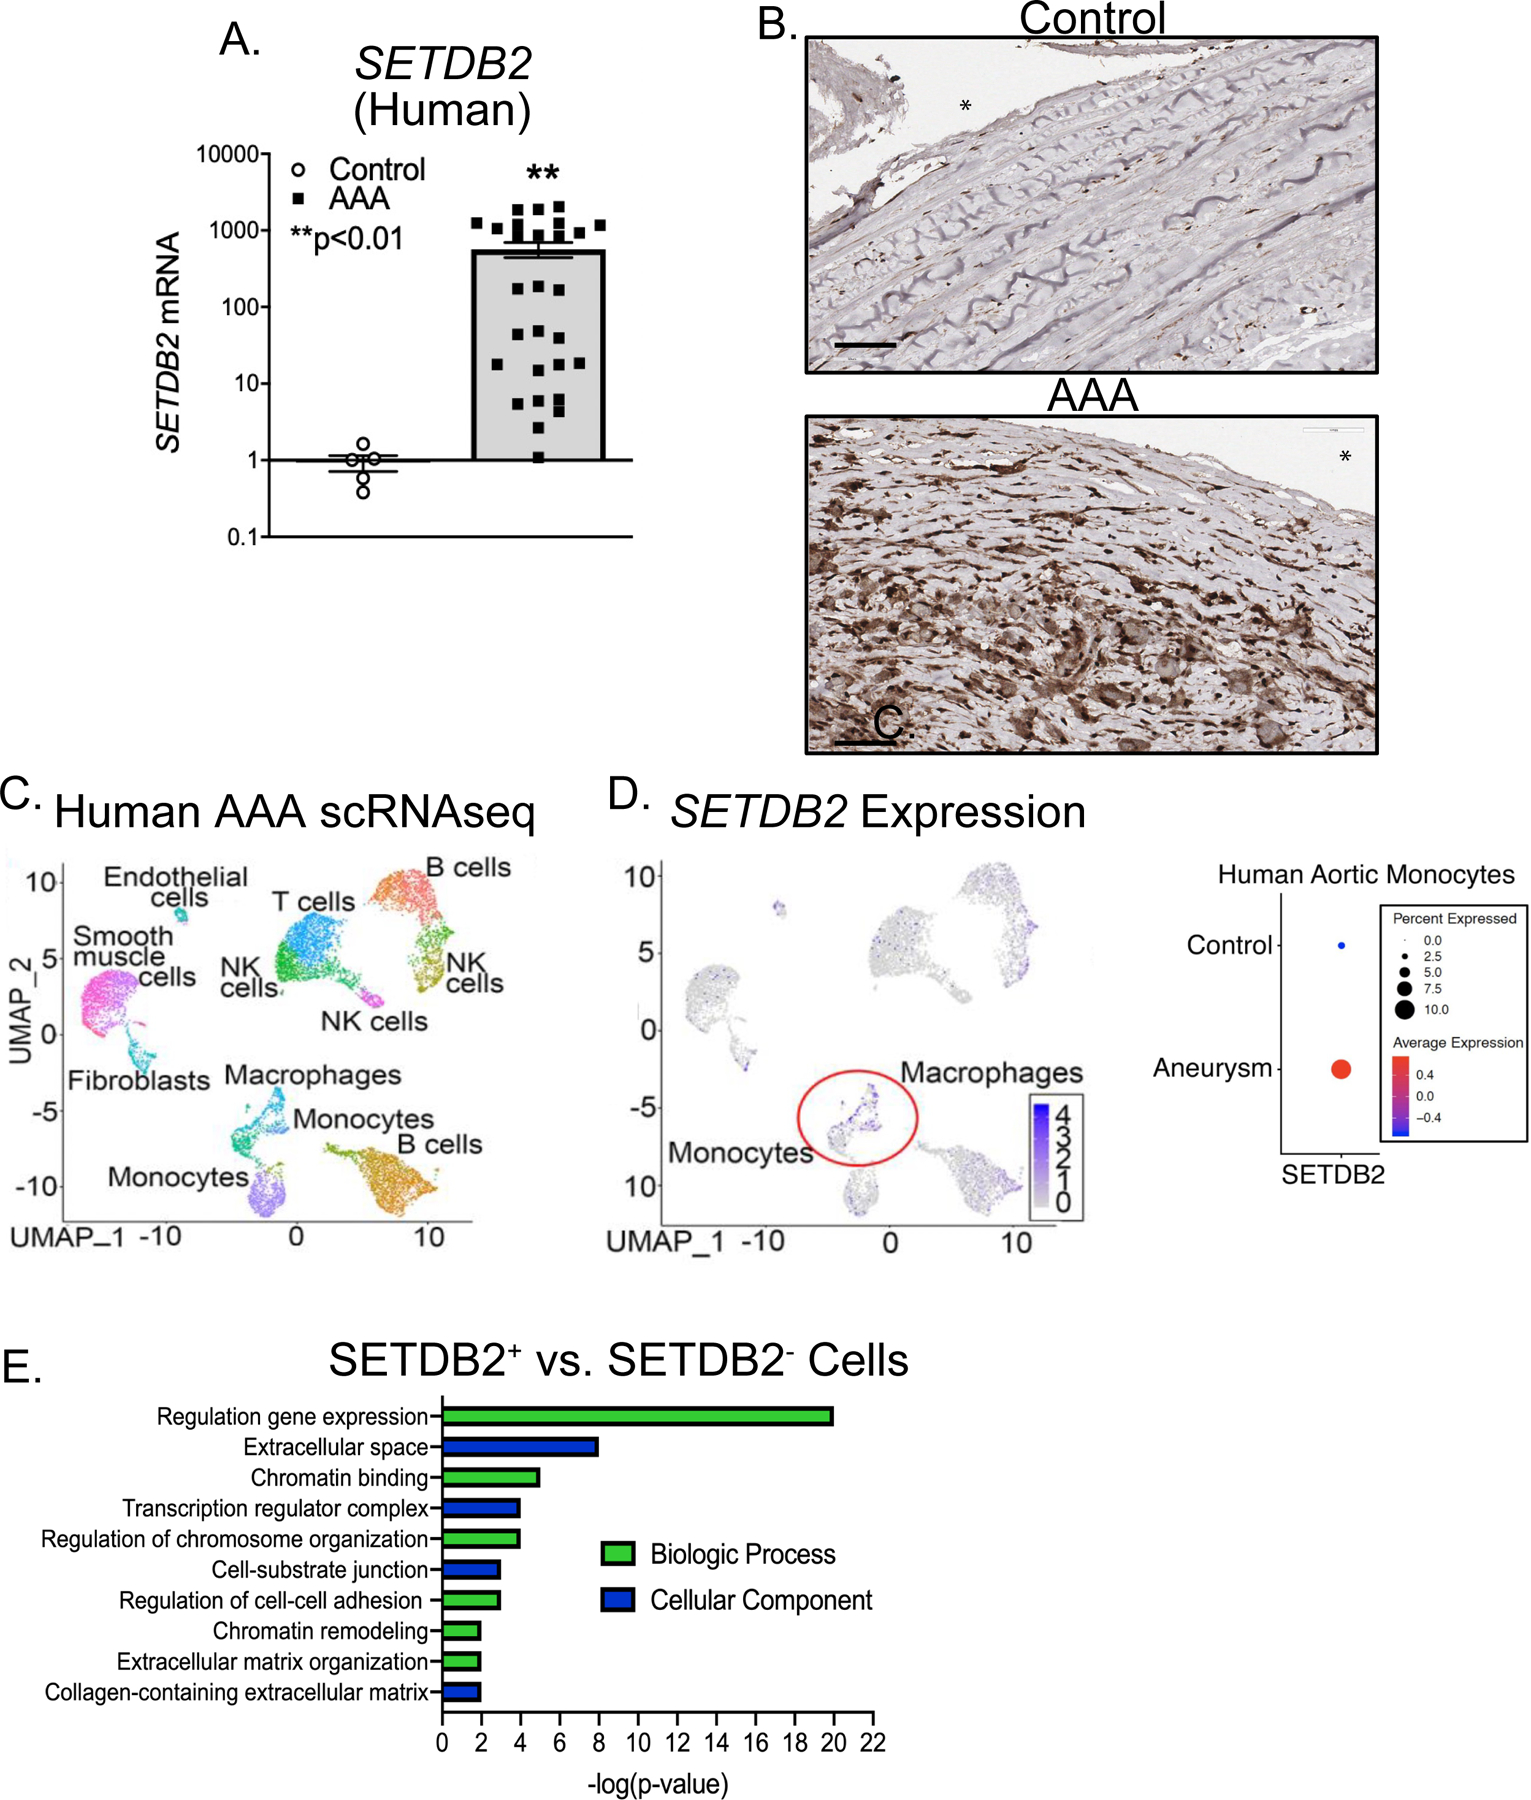
A. Aortic tissue from patients with AAA (n=19) and atherosclerotic controls (n=6) were collected. No statistical differences were found between groups with respect to sex, age, or comorbid conditions. SETDB2 gene expression was measured by qPCR with log scale. *p<0.05 by Welch’s t test replicated twice. B. Immunohistochemistry was performed for SETDB2 in human control and AAA samples. Representative slides are shown at 40X and scale bar is 60 μm. C. Cluster analysis using the uniform manifold approximation and projection (UMAP) technique of single cell sequencing from human AAA (n=4) and nonaneurysmal (n=2) samples revealed 21 distinct cell clusters (representative). D. Feature plots displaying the single cell gene expression of SETDB2 across cell clusters. E. Gene Ontology biological process or cellular component enrichment analysis of differentially expressed genes SETDB2+ vs. SETDB2− cells. The combined score metric corresponds to the P value (two-tailed Fisher’s exact test) multiplied by the Z-score of the deviation from the expected rank, and q values determined by Benjamini–Hochberg correction.