
Figure 3. AAA Formation is Inhibited in Macrophage-specific SETDB2-deficient Mice.
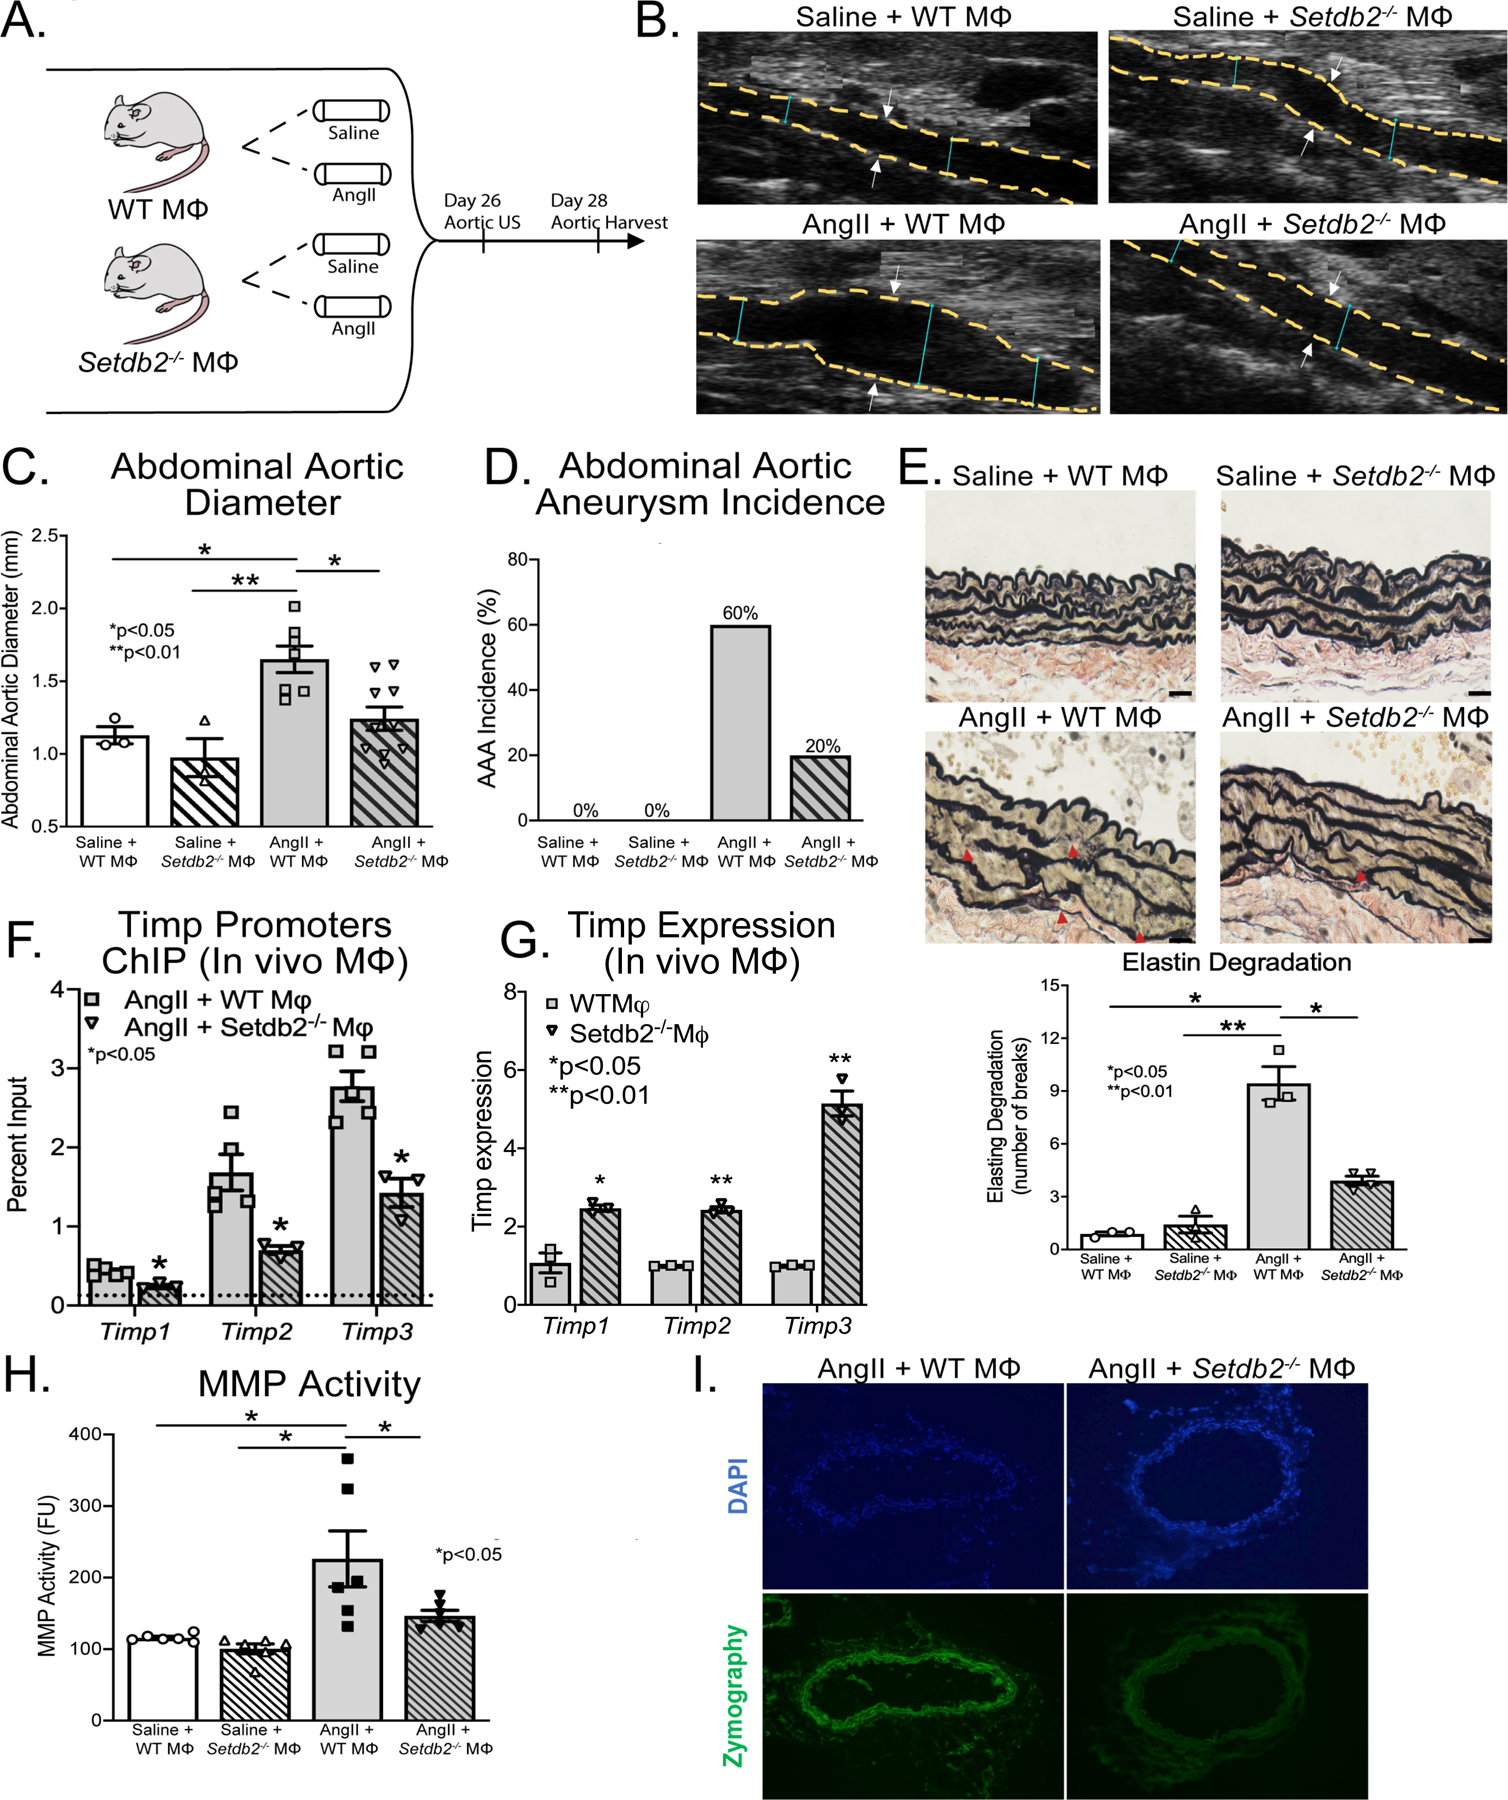
A. Experimental design of macrophage-specific SETDB2-deficiency in murine AAA model. Wild-type (WT M𝛷) mice and mice with macrophage-specific SETDB2 deficiency (Setdb2−/− M𝛷) were fed high fat diet for 6 weeks and infused with saline or AngII infusion (1,000 ng/min/kg) for 4 weeks. B. Representative ultrasound images of the abdominal aorta at day 28 in WT M𝛷 or Setdb2−/− M𝛷 following either saline or AngII infusion. Dotted line represents aortic contour and arrows represent aortic wall diameter. C, D. Maximal abdominal aortic diameter and aneurysm incidence as determined by ultrasound measured by two observers in WT M𝛷 or Setdb2−/− M𝛷 infused with either saline or AngII (n= 6 in saline infused cohorts and 20 in AngII infused cohorts). *p<0.05; **p<0.001 by ANOVA with Newman-Keuls Multiple Comparison test. Data are presented as the mean±SEM. E. Representative Verhoeff–van Gieson elastin staining of abdominal aortic sections showing preserved aortic structure in Setdb2−/− M𝛷 + AngII compared with WT M𝛷 + AngII mice; scale bar is 200 μm in Verhoeff–van Gieson stain; arrows represent elastin fragmentation. Average number of elastin fragmentation per high power field. F. ChIP analysis for H3K9me3 at Timp1, Timp2, and Timp3 promoter was performed on macrophages (CD11b+[CD3−CD19−Nk1.1−Ly6G−]) isolated from AngII + WT M𝛷 and Setdb2−/− M𝛷 at day 28 (n=5 mice/group pooled and run in triplicate). For all ChIP experiments, isotype-matched IgG was run in parallel. Dotted line represents isotype-matched control. **p<0.01 for Mann-Whitney U test. G. Timp1, Timp2, and Timp3 expression were measured by quantitative PCR in in vivo M𝛷s isolated from WT M𝛷 or Setdb2−/− M𝛷 following AngII infused mice on day 28 (n=3/group run in triplicate). *p<0.05, **p<0.01 by Mann-Whitney U Test. H. MMP activity was measured in protein abdominal aorta extracts by fluorometry and measured in fluorometric units. Data represent the mean±SEM from n=6 animals per group. Statistical analysis was performed by 1-way ANOVA (Newman-Keuls post hoc test). *p<0.05. I. MMP activity in abdominal aortic sections by in situ zymography. Representative images are shown with green signal corresponding to active MMPs; blue signal corresponding to DAPI staining for cell nuclei.