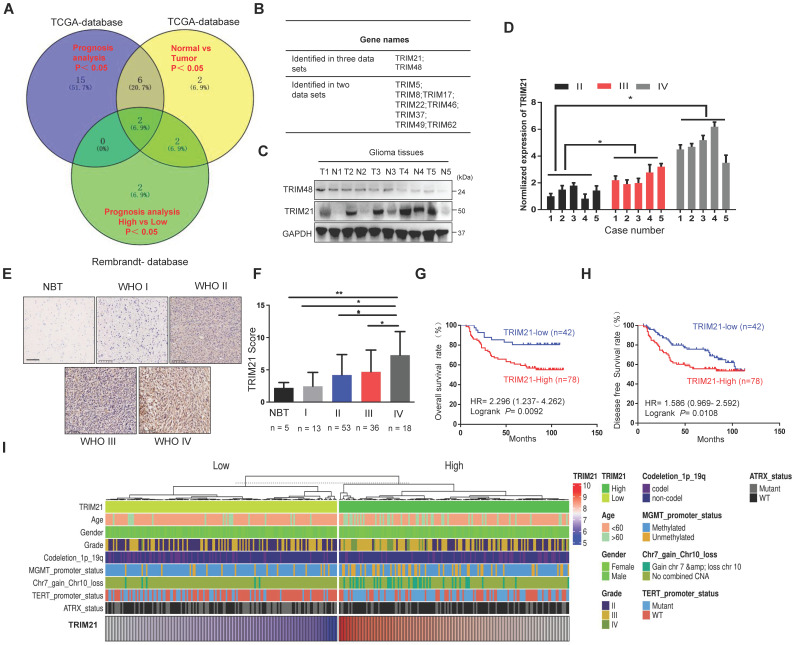
Figure 1.
TRIM21 is highly expressed in GBM samples and correlates with poor prognosis. (A) Venn diagram showing the number of changed proteins from TRIMs family identified in TCGA-datasets in GBM relative to normal brain tissue samples (Blue) and the prognosis difference using Kaplan-Meier curves in GBM from TCGA-database (Yellow) and Rembrandt-Database (Green) and overlapping proteins in the datasets. (B) TRIM21 and TRIM48 were identified. (C) Western blotting of TRIM21 and TRIM48 protein in 5 paired surgically removed glioma (T) and the corresponding adjacent normal tissues (N). (D) The mRNA of TRIM21 in glioma in different grades. (E-F) Representative IHC staining images (E) and score (F) of TRIM21 in WHO grade I-IV glioma tissue microarrays and normal brain tissues (NBT). Scale bar, 100 μm. (G-H) Kaplan-Meier curves showing the relationship between the expression of TRIM21 and the overall survival rate (G) and Disease-free survival rate (H) of patients with glioma (n = 120). (I) Heatmap showing the distribution of clinical features and genetic characteristics and TRIM21 expressions in glioma specimens from TCGA-LGGGBM database (n = 330).

