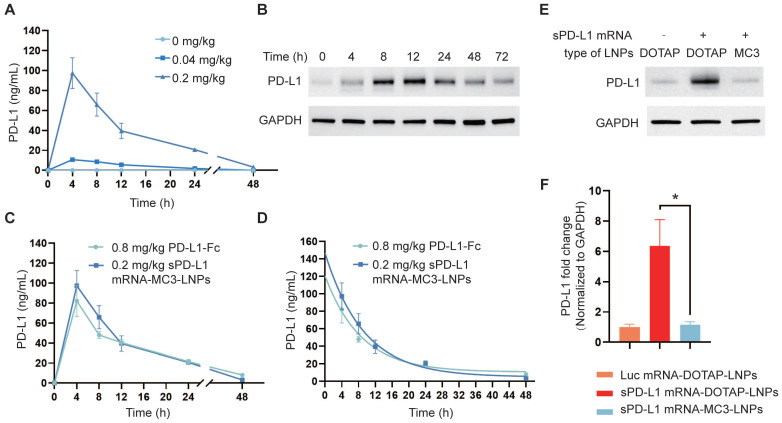
Figure 3.
Expression of sPD-L1 mRNA-MC3-LNPs and mRNA-DOTAP-LNPs in vivo. (A) PD-L1 levels in circulatory system over time (0 h, 4 h, 8 h, 12 h, 24 h, 48 h) after intravenous injection of sPD-L1 mRNA-MC3-LNPs (0, 0.04 or 0.2 mg/kg). (B) PD-L1 levels in lung tissue over time (0 h, 4 h, 8 h, 12 h, 24 h, 48 h) after intravenous injection of sPD-L1 mRNA-DOTAP-LNPs (0.2 mg/kg). The expression level of PD-L1 in the lysate of lung tissue were valued by western blot. (C) Blood concentration of sPD-L1 after intravenously injection of sPD-L1 mRNA-MC3-LNPs (0.2 mg/kg) or PD-L1-Fc recombinant protein (0.8 mg/kg) into mice (n = 4), and blood samples were collected at different time points (0 h, 4 h, 8 h, 12 h, 24 h, 48 h) to determine protein expression by ELISA kit. (D) The half-life of sPD-L1 mRNA-MC3-LNPs (0.2 mg/kg) and PD-L1-Fc chimera (0.8 mg/kg). (E) Expression level of PD-L1 in lung tissue detected by western blot assay. The tissues were collected at 4 hours after intravenous injection of Luc mRNA-DOTAP-LNPs (0.2 mg/kg), sPD-L1 mRNA-DOTAP-LNPs (0.2 mg/kg) or sPD-L1 mRNA-MC3-LNPs (0.2 mg/kg). (F) Comparison of the PD-L1 abundance in lung tissue between groups. Results represent mean ± SEM (n = 3). *p < 0.05. t-test analysis.

