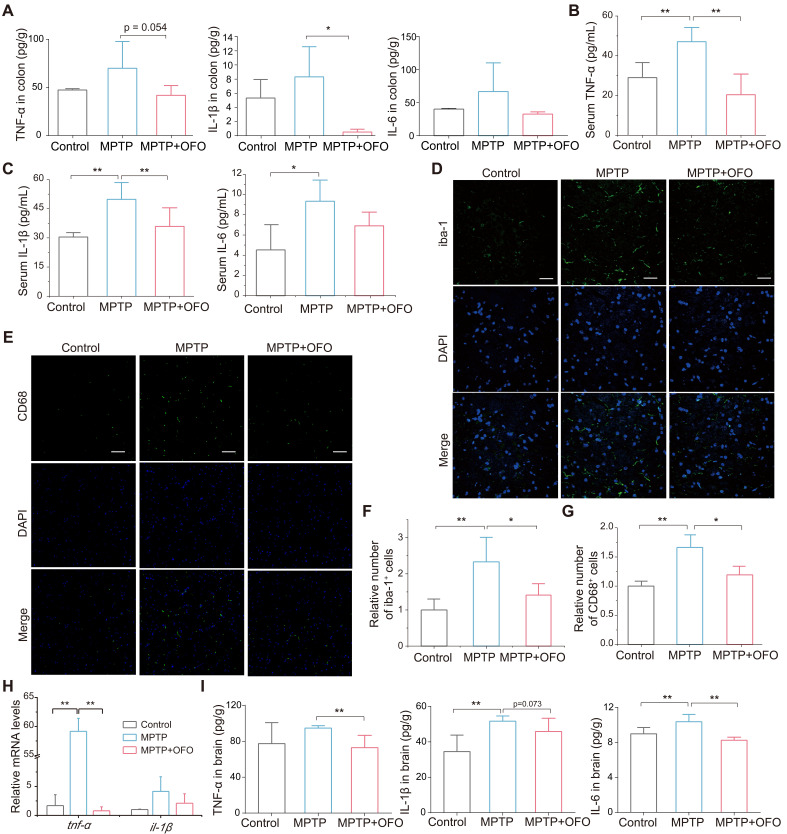
Figure 3.
OFO deactivated microglia and reduced neuroinflammation. (A) The contents of TNF-α, IL-1β, and IL-6 in colon tissues. (B-C) The levels of TNF-α, IL-1β, and IL-6 in the serum. (D) Fluorescence microscopy of iba-1+ (green) microglia and DAPI (blue) in substantia nigra. Scale bars represent 40 μm. (E) Fluorescence microscopy of CD68 (green) and DAPI (blue) in substantia nigra. Scale bars represent 60 μm. (F) Quantitative analysis of immunofluorescence of iba-1. (G) Quantitative analysis of immunofluorescence of CD68. (H) The mRNA expression of tnf-α and il-1β in the midbrain. (I) The contents of TNF-α, IL-1β, and IL-6 in brain tissues. Data are the mean ± S.D. n = 3-6 in each group. *p < 0.05 and **p < 0.01. Data were analyzed using one-way ANOVA with LSD test or Games-Howell test by SPSS.

