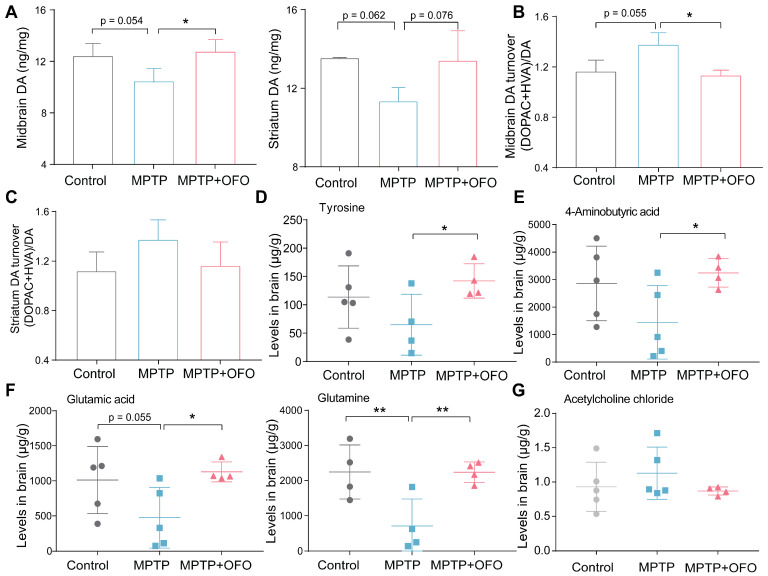
Figure 5.
The effects of OFO on neurotransmissions of MPTP-induced PD mice. (A) The contents of DA in the midbrain and striatum. (B-C) DA turnover ratio (DOPAC+HVA)/DA in the midbrain (B) and striatum (C). (D) The levels of tyrosine in brain tissues. (E-F) The levels of 4-aminobutyric acid, glutamic acid, and glutamine in brain tissues. (G) The levels of acetylcholine chloride (Ach) in brain tissues. Data are the mean ± S.D. n = 4-6 in each group. *p < 0.05 and **p < 0.01. Data were analyzed using one-way ANOVA with LSD test or Games-Howell test by SPSS.

