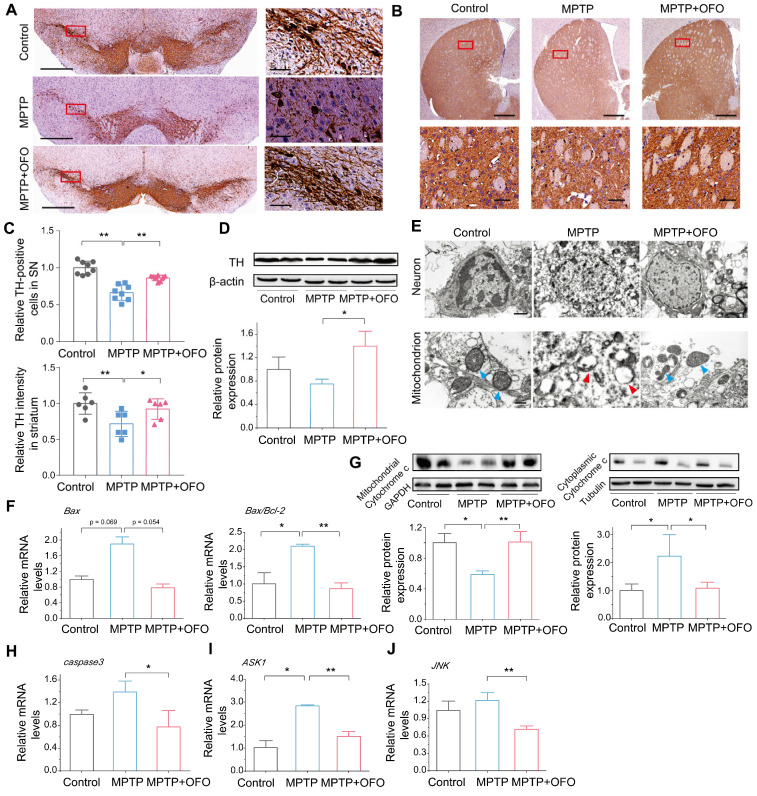
Figure 6.
The prevention of dopaminergic neuronal degeneration by OFO in MPTP-induced PD mice. (A) IHC images of TH in SN. The right pictures are the magnification of the red rectangle in the left. The bar: left 500 μm, right 50 μm. (B) IHC images of TH in striatum. The bottom pictures are the magnification of the red rectangle in the top. The bar: top 500 μm, bottom 50 μm. (C) Quantitative analysis of TH-positive neurons in SN and in striatum. (D) WB and quantitative analysis of TH in the midbrain. (E) The ultrastructure of dopaminergic neurons and mitochondrion in the control, MPTP, and MPTP+OFO groups by TEM. Scale bar: 1 μm and 400 nm. The blue arrows refer to the normal mitochondria. The red arrows refer to the damaged mitochondria. (F) The mRNA expression of Bax and the ratios of Bax/Bcl-2 in the midbrain by Q-PCR analysis. (G) The protein expression of cytochrome c in the mitochondrion and cytoplasm of neurons in the midbrain by WB. (H) The mRNA expression of caspase3 in the midbrain. (I-J) The mRNA expression of ASK1 (I) and JNK (J) in the midbrain. Data are the mean ± S.D. n = 3-6 in each group. *p < 0.05 and **p < 0.01. Data were analyzed using one-way ANOVA with LSD test or Games-Howell test by SPSS.

