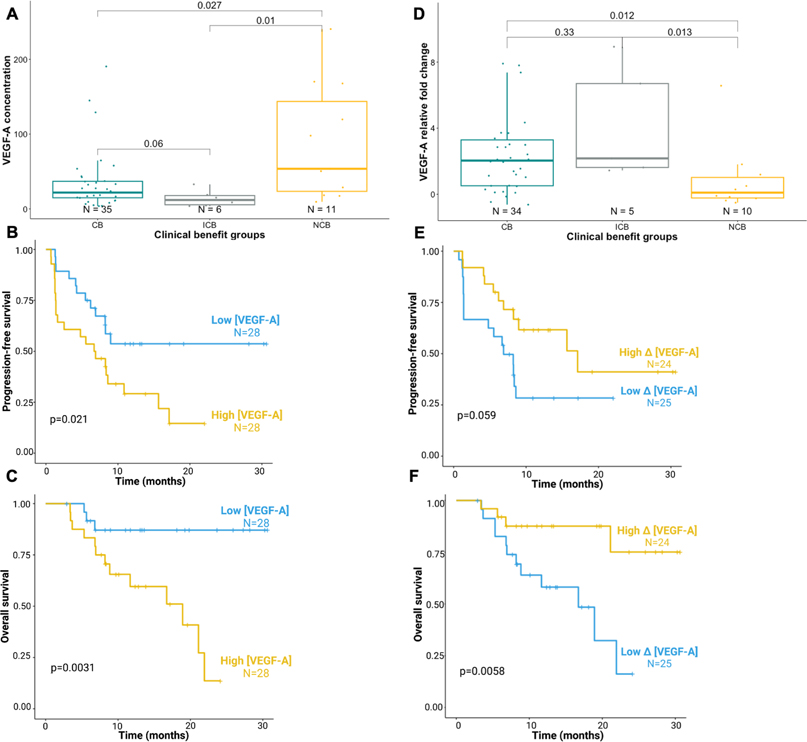
Figure 3. Association of baseline and early changes in VEGF-A concentrations with clinical outcomes.
Paired blood samples from 60 patients (at baseline and on-treatment) were analyzed using a multiplex immunoassay to quantify circulating VEGF-A levels at baseline and on treatment.
(A-C) Patients with higher baseline VEGF-A expression have worse clinical outcomes with atezolizumab plus bevacizumab, with (A) higher rate of therapy resistance (NCB; pairwise Wilcoxon test; N=52), and shorter (B) PFS and (C) OS (log-rank-tests; N=56).
(D- F) Relative increase in VEGF-A concentration on-treatment is associated with improved (D) response (pairwise Wilcoxon test; N=49), (E) PFS, and (F) OS (log-rank-test; N=49).
In panels B, C, E, F time is since initiation of therapy.
High Δ[VEGF-A] corresponds to a higher relative increase in VEGF concentration, low Δ [VEGF-A] is a lower relative increase or a decrease in VEGF concentration. The threshold for statistical significance in all the analyses was set at a p-value of 0.05.
Boxplots: Median (solid line within the box): the line inside the box represents the median, which is the central value in the dataset. Box (rectangle): the box represents the interquartile range (IQR), which spans from the 25th percentile (lower edge of the box) to the 75th percentile (upper edge of the box). Whiskers (vertical lines extending from the box): the whiskers depict the range of the data excluding outliers, they extend to 1.5 times the IQR.
Abbreviations: Δ [VEGF-A]: ([VEGF-A (C3D1) – [VEGF-A (C1D1)])/ – [VEGF-A (C1D1), C1D1: Day 1 of Cycle 1 of treatment, C3D1: Day 1 of Cycle 3 of treatment, VEGF-A: vascular endothelial growth factor A.

