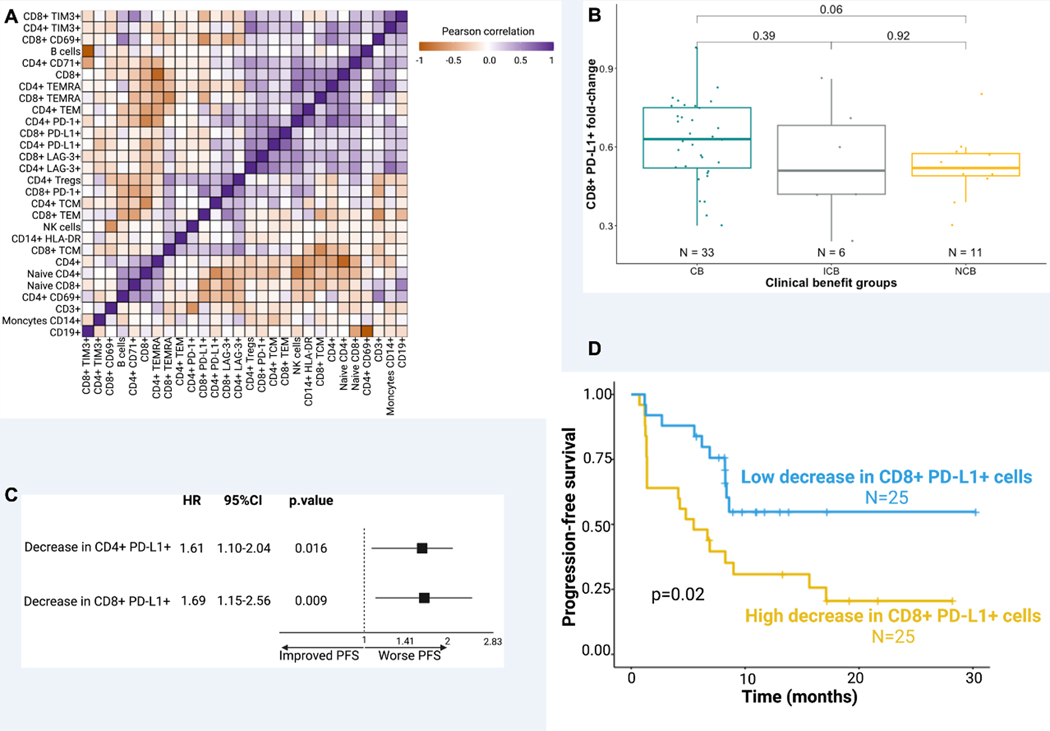
Figure 4. Dynamic changes in PD-L1 expressing circulating T cells are associated with treatment-related outcomes.
Paired blood samples from 60 patients (at baseline and on-treatment) were analyzed using a flow cytometry to quantify circulating immune cells at baseline and on treatment.
A) Unsupervised hierarchical clustering of Pearson correlations between baseline immune cell levels.
B) Boxplots demonstrating the association of the change of CD8+ PD-L1+ cell levels (from C1D1 to C3D1) with CB (pairwise Wilcoxon tests; N=50).
C) Forest plots for PFS hazard ratios in patients treated with atezolizumab+bevacizumab by ratio of on-treatment to baseline circulating CD4+ and CD8+ cells expressing PD-L1 (Cox univariate regression; N=50).
D) Kaplan-Meier curves showing that lower decrease (C3D1/C1D1 ratio ≤ median ratio) in CD8+ PD-L1+ cells on treatment is associated to improved PFS (log-rank-test; N=50).
In panel D, time is since initiation of therapy. The threshold for statistical significance in all the analyses was set at a p-value of 0.05.
Boxplots: Median (solid line within the box): the line inside the box represents the median, which is the central value in the dataset. Box (rectangle): the box represents the interquartile range (IQR), which spans from the 25th percentile (lower edge of the box) to the 75th percentile (upper edge of the box). Whiskers (vertical lines extending from the box): the whiskers depict the range of the data excluding outliers, they extend to 1.5 times the IQR.

