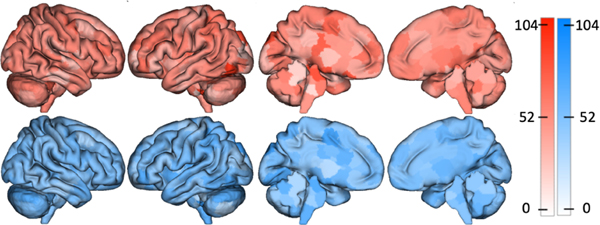
Fig. 3:
Reconstructed connectomes give similar aging results as the original connectomes. The top row shows the nodes with the largest number of edges significantly associated with age for original connectomes from the HCP created with the Shen atlas. The bottom row shows the same but using reconstructed Shen connectomes. These spatial maps correlate at , suggesting that analyses with the reconstructed connectomes produce comparable neuroscientific insights as analyses with the original connectomes.

