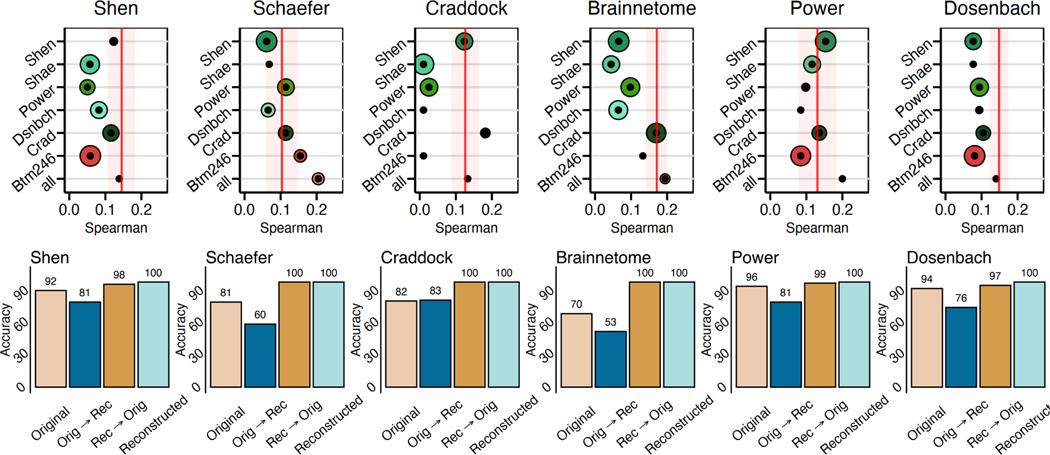
Fig. 4:
Reconstructed connectomes behave the same as original connectomes in downstream analyses. A) The reconstructed connectomes retain sufficient individual differences to predict IQ using connectome-based predictive modeling. In all cases, reconstructed connectomes based on all available source atlases (bottom circle) predicted IQ with a similar or better correlation between the observed and predicted values than the original connectome (red line). Size of the circle represents the variance of prediction performance of 100 iterations of 10-fold cross-validation. B) The reconstructed connectomes retain sufficient individual uniqueness to identify individuals using the reconstructed connectomes.

