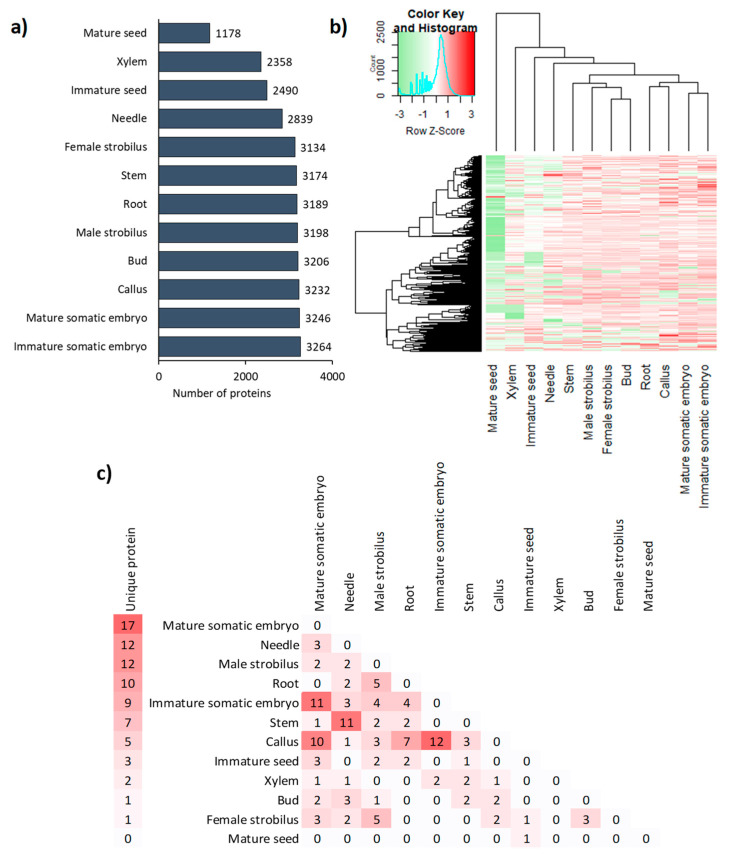
Figure 1.
Specificity of protein abundances in the proteomes of 12 Douglas fir organs. (a) Bar plot of the number of proteins present in each organ. (b) Heatmap displaying log10-transformed counts of the quantifiable proteins for all organs. (c) Number of proteins present in only one organ (left side) or two organs (right side). For each organ, the presence or the average abundance of proteins is presented from 3 independent batches.

