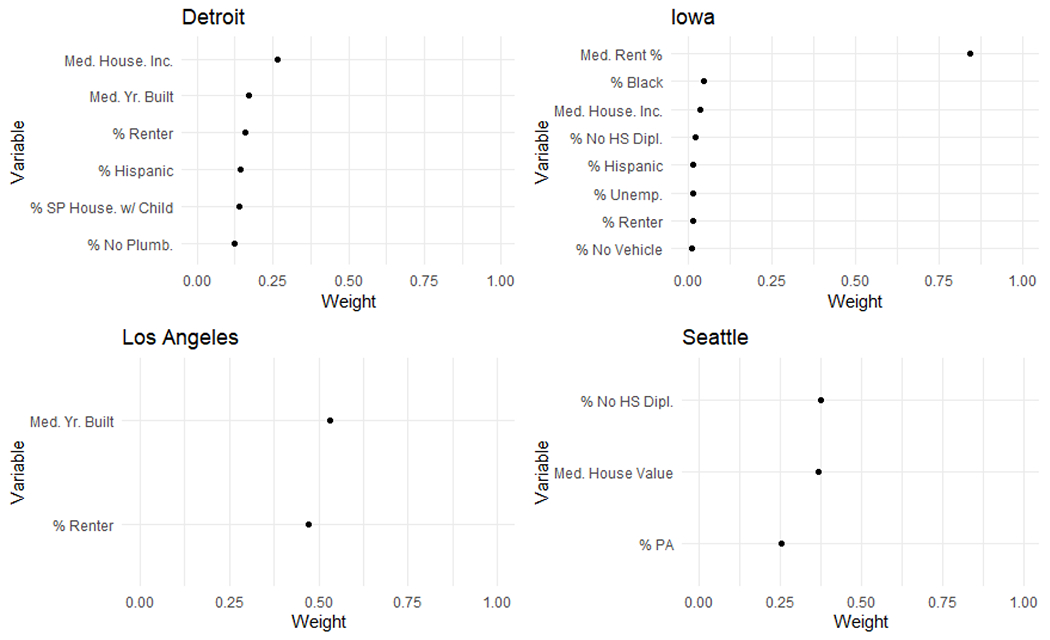
Figure 2.

Estimated importance weights in the 1980 deprivation index in the best-fitting models at each study center for Level 3. %PA represents the percent of households in a census tract receiving public assistance income.

Estimated importance weights in the 1980 deprivation index in the best-fitting models at each study center for Level 3. %PA represents the percent of households in a census tract receiving public assistance income.