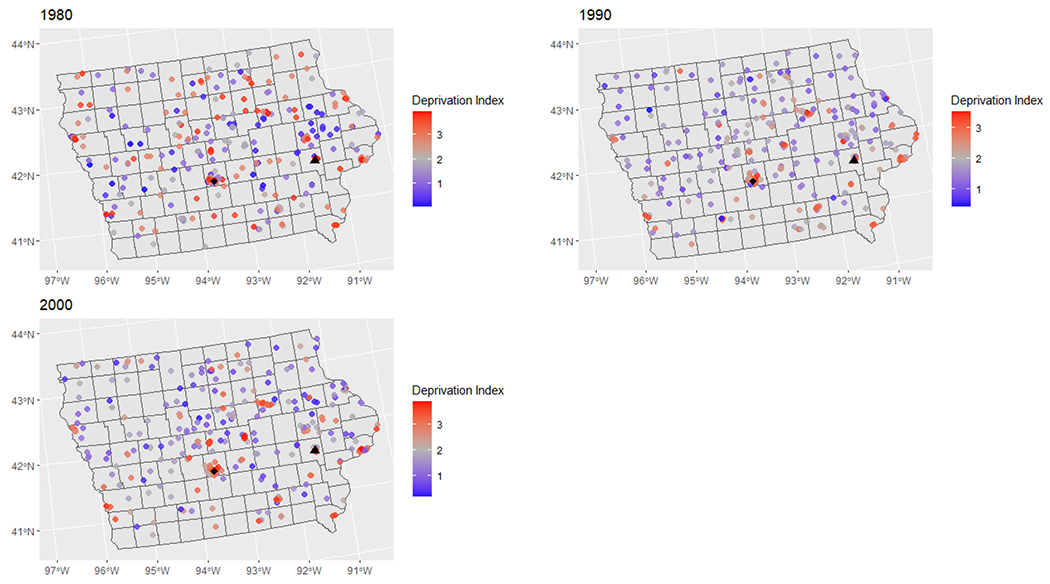
Figure 3.

Map of the estimated neighborhood deprivation index in 1980, 1990, and 2000 in Iowa for jittered participant locations at the time of each census.
Note: Red areas represent higher areas of deprivation. Participant locations have been randomly jittered for privacy. The black triangle represents Iowa City and the black diamond represents Des Moines. The Mississippi River forms the eastern border of the state.
