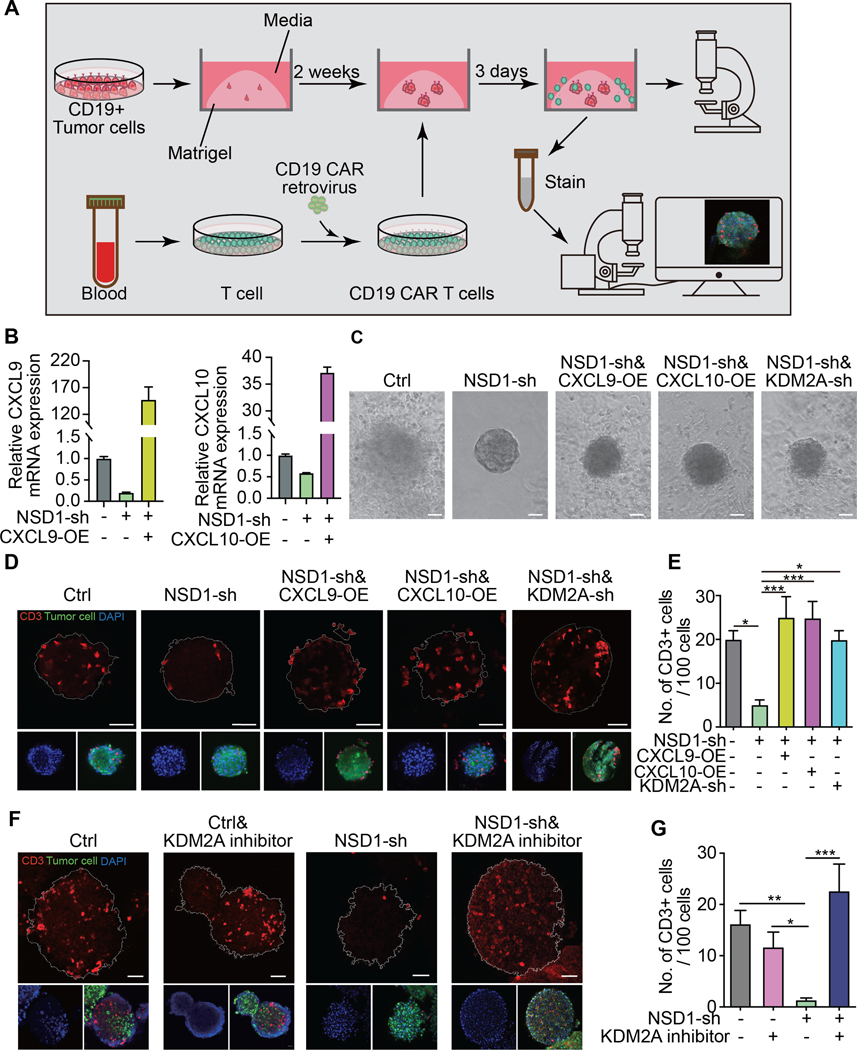
Figure 3. KDM2A inhibition reverses the immune cold phenotype induced by NSD1 inactivation and induces T cell infiltration into the tumor microenvironment.
(A) Overview and illustration of experiment workflow. Tumor spheroids were established from HNSCC tumor cells transfected to express truncated CD19 on the cell surface and grown in submerged Matrigel. The spheroids were co-cultured with CD19-CAR-T cells for three days and then isolated for analysis by confocal microscopy. (B) Assessment by qRT-PCR of CXCL9 and CXCL10 expression after CXCL9 or CXCL10 overexpression (OE) in FaDu cells transduced to express shRNA targeting NSD1 (NSD1-sh). (C) Representative images of tumor spheroids after co-cultured with CD19-CAR-T cells for 3 days. Ctrl = vector control; NSD1-sh = shRNA targeting NSD1; CXCL9-OE = overexpression construct for CXCL9; CXCL10-OE = overexpression construct for CXCL10; KDM2A-sh = shRNA targeting KDM2A. Scale bar=50um. (D) Representative images of tumor spheroids stained with anti-CD3 antibody (red) and DAPI (blue). Scale bar=50 um. (E) Quantification of CD3+ cells per 100 cells in the spheroids. (F) Representative images of FaDu tumor spheroids expressing control or NSD1 targeted shRNA with or without the KDM2A inhibitor (daminozide) treatment. The spheroids were stained with anti-CD3 antibody (red) and DAPI (blue). Scale bar=50 um. (G) Quantification of CD3+ cells per 100 cells in the spheroids. Data shown are representative of experiments repeated at least three times. Error bars represent standard error of the mean (SEM). * p <0.05, ** p <0.01, *** p ≤0.001.

