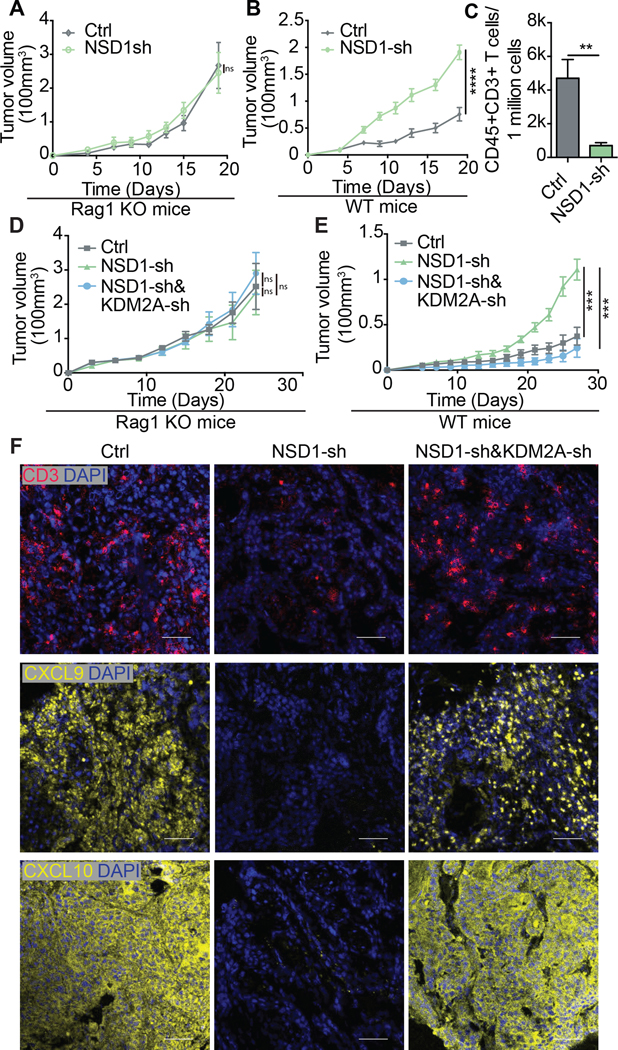
Figure 4. KDM2A inhibition induces T cell infiltration of the tumor microenvironment in vivo.

Growth curves of MOC1 control (vector control) and NSD1 knockdown (NSD1-sh) tumors in syngeneic Rag1–/– (Rag1 KO) mice (n=6 for each group) (A) and wild-type mice (n=8 per group) (B). (C) Tumor infiltrating T cells (CD45+CD3+) were quantified by flow cytometry of dissociated tumors. Growth curves of MOC1 control, NSD1 knockdown (NSD1-sh) and NSD1 and KDM2A double-knockdown (NSD1-sh & KDM2A-sh) cells in Rag1 KO mice (n=6 for each group) (D) and wild-type mice (n=5 for each group) (E). (F) Representative immunofluorescence images of CD3, CXCL9, and CXCL10 expression (red) in tumors formed from MOC1 cells transduced with vector control (Ctrl), NSD1 shRNA (NSD1-sh), or both NSD1 shRNA and KDM2A shRNA (NSD1-sh&KDM2A-sh). Scale bar=50 um. Blue stain=DAPI. Error bars represent standard error of the mean (SEM). *** p ≤0.001. ns = not significant.
