
Figure 4. Unique spatial transcription markers in placentae depending on SARS-CoV-2 detection levels.
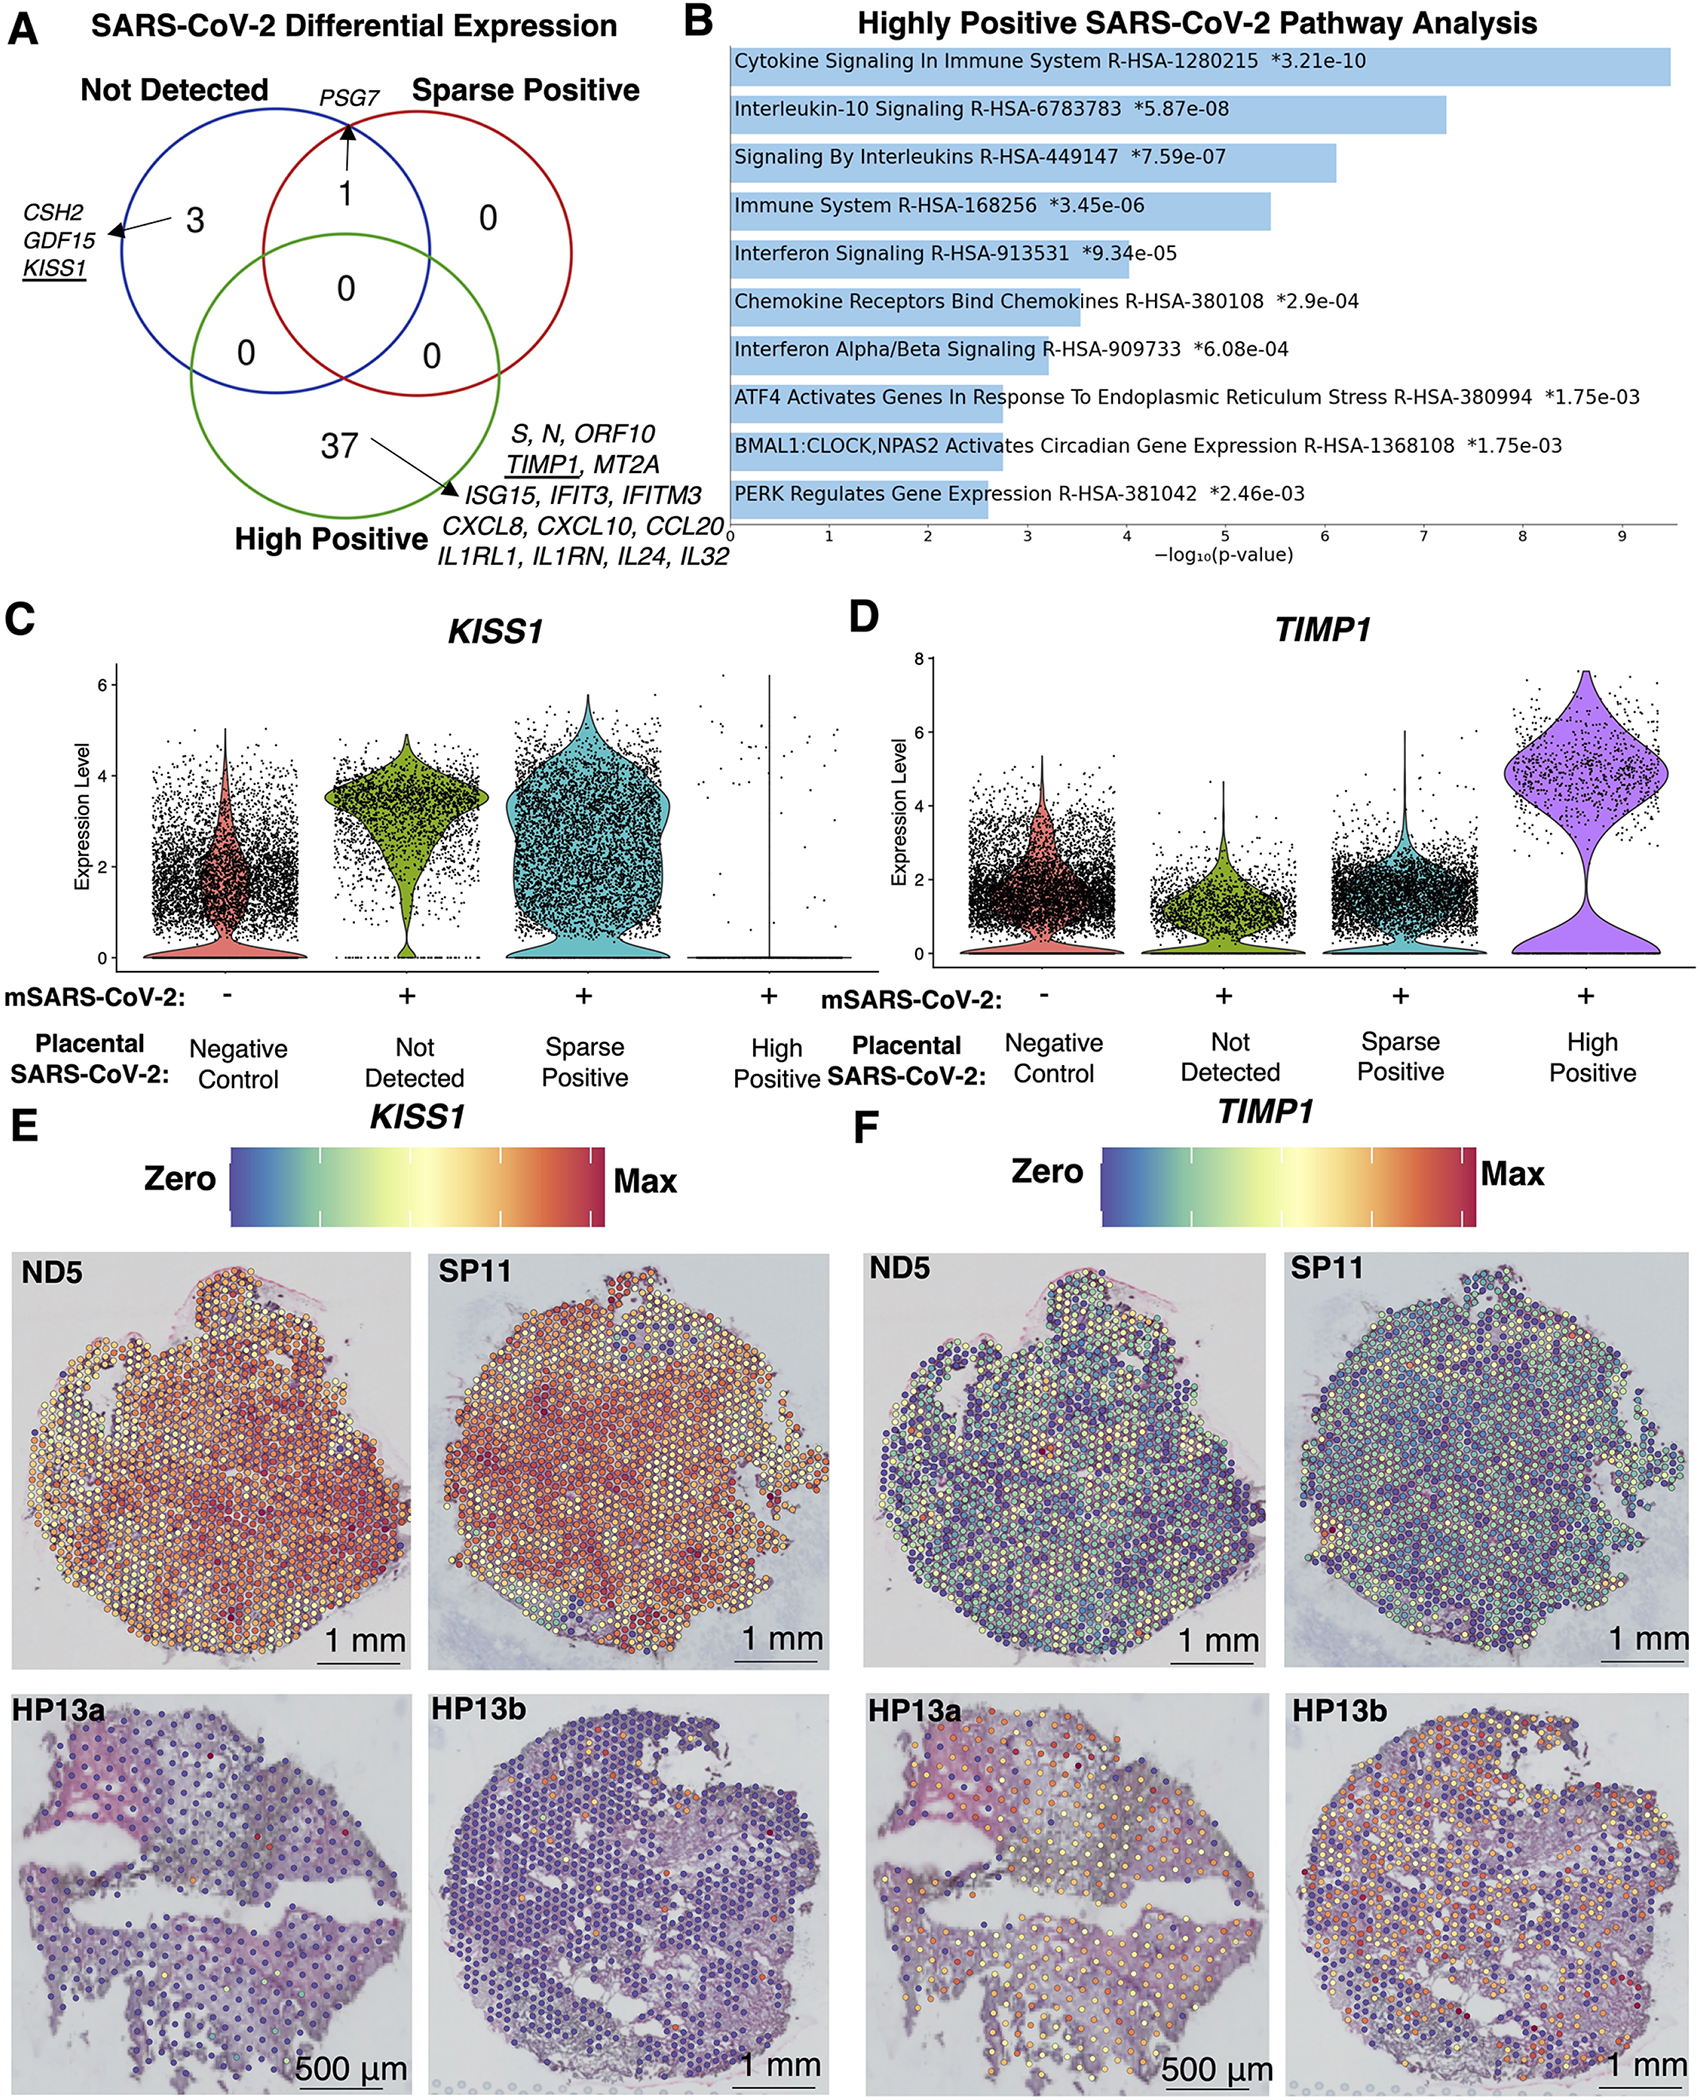
(A) Differential expression between spatial transcriptomes in each analysis cohort relative to the negative controls identified 54 significantly differentially expressed transcripts (q<0.05, Log2(fold-change)>2) unique or shared between analysis cohorts. (B) The 37 transcripts unique to highly positive SARS-CoV-2 placentae were subject to EnrichR pathway analysis with the Reactome 2022 database, revealing the top 90th-quartile of significant (q<0.05) pathways. (C-D) Violin plots with the expression levels of KISS1 and TIMP1, which were markers for placentae where SARS-CoV-2 was not detected or highly positive, respectively. (E-F) Spatial gene expression of KISS1 and TIMP1 representative of each analysis cohort.