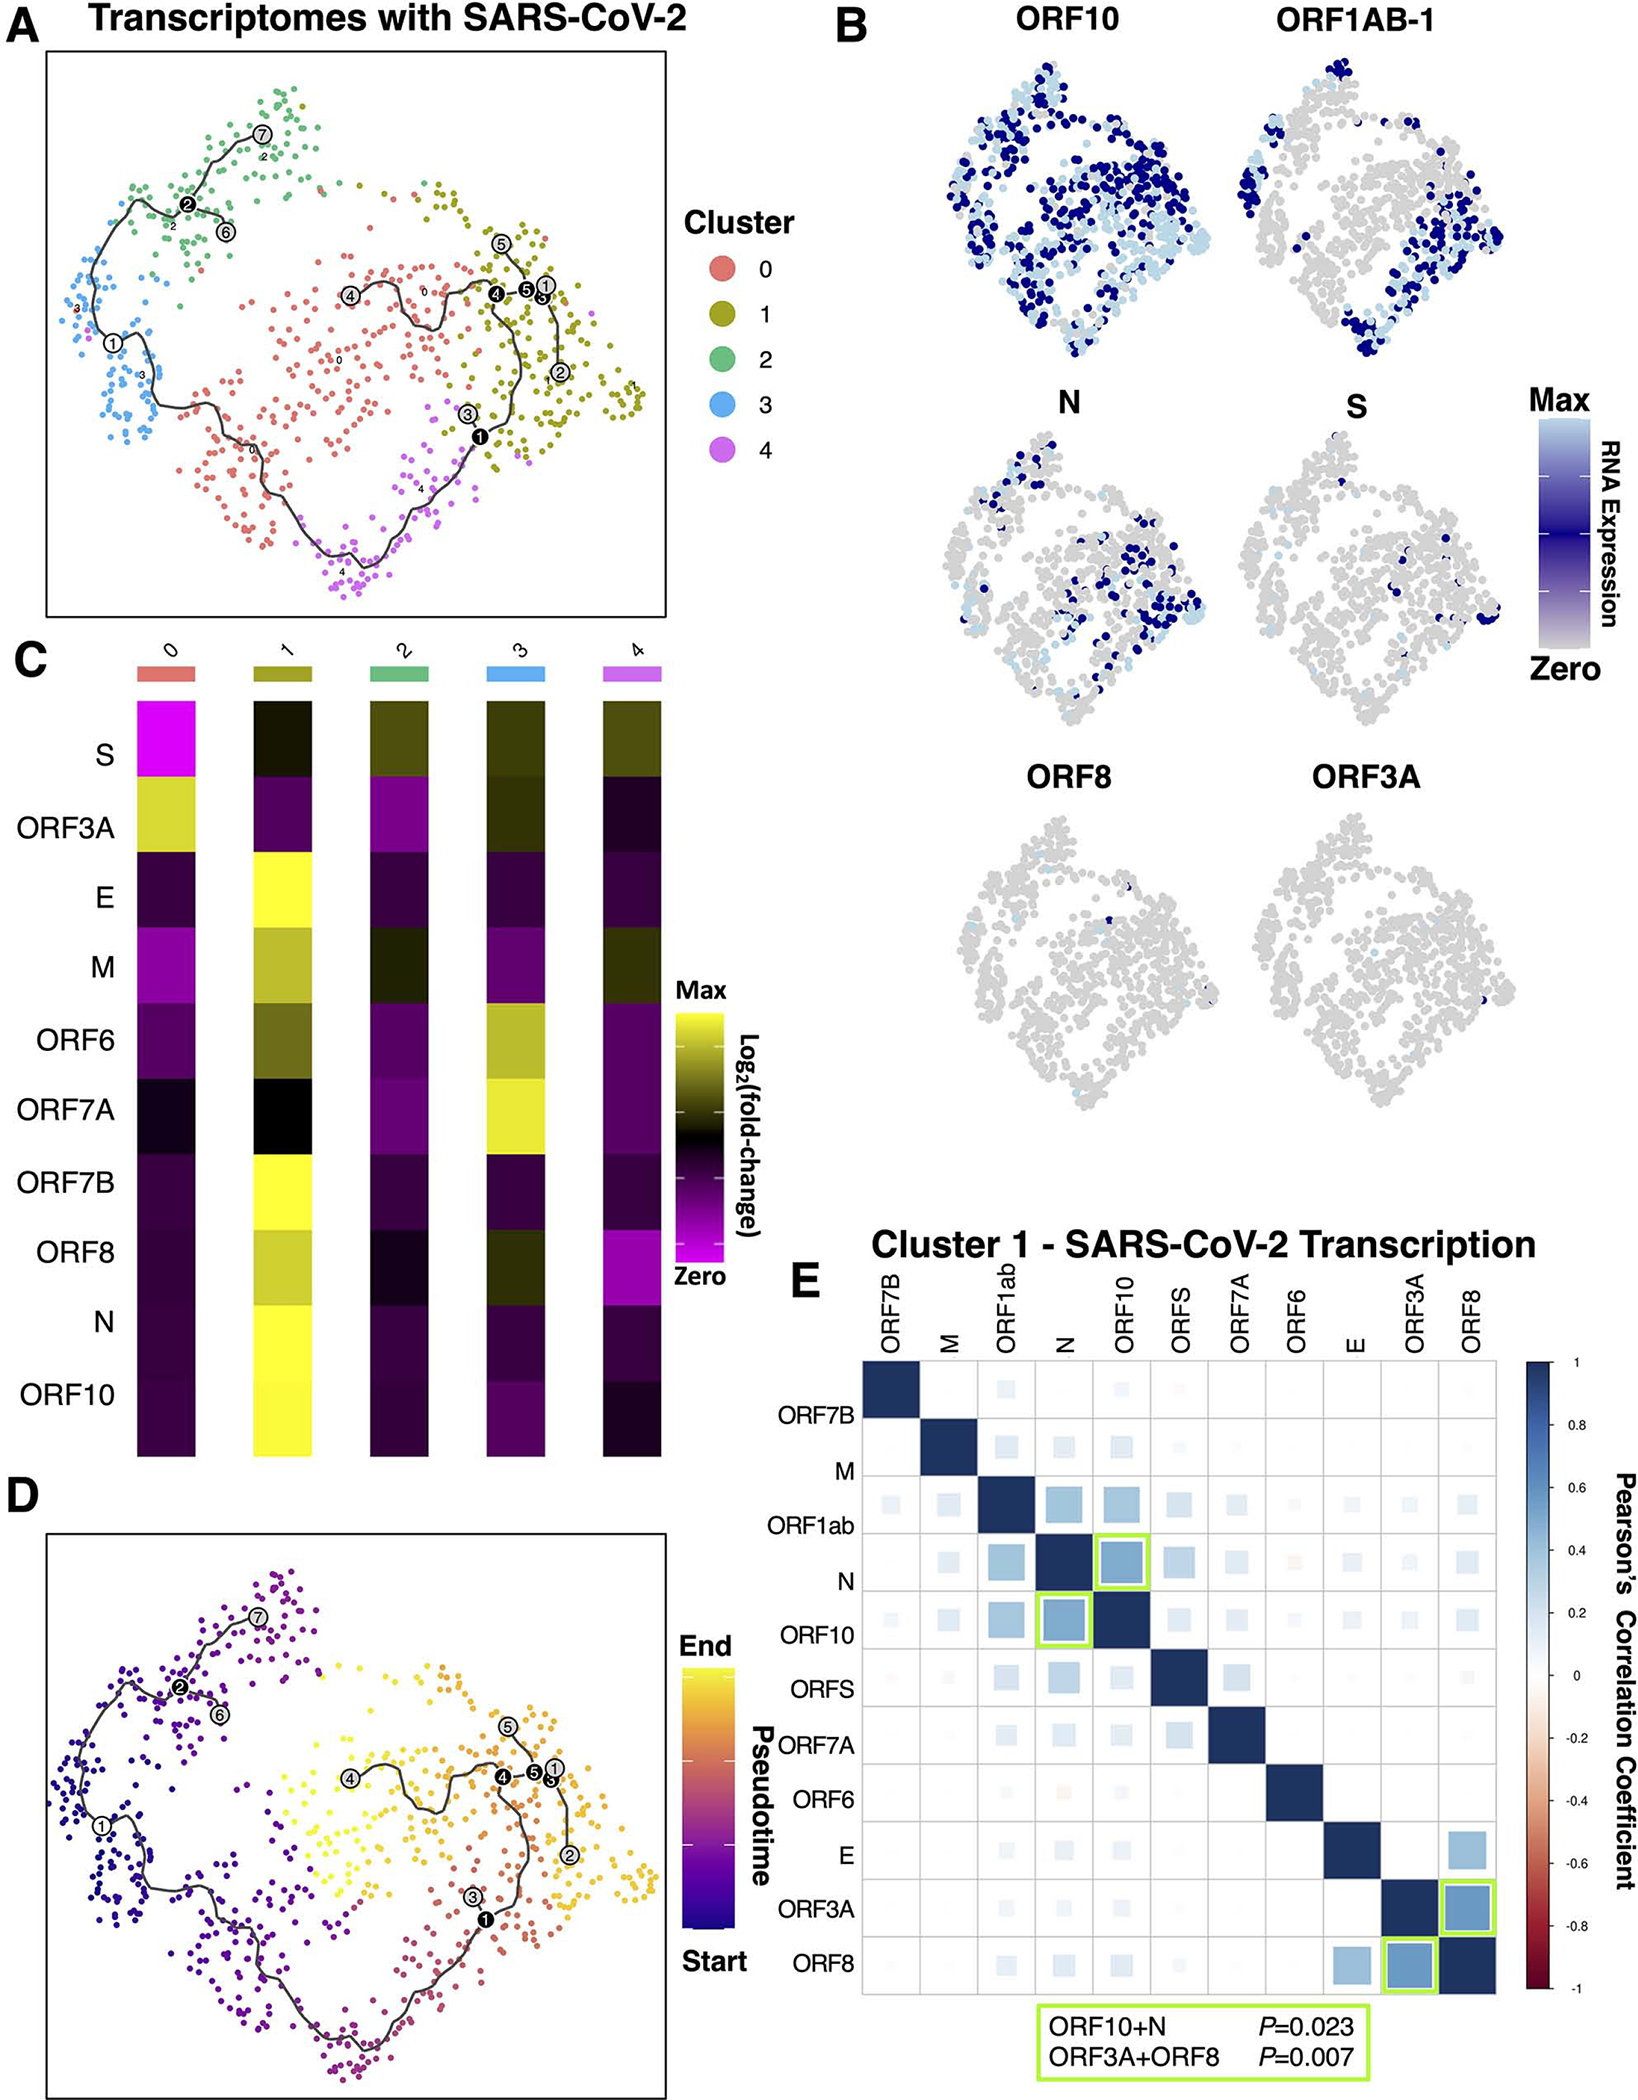
Figure 5. Analysis of infected spatial transcriptomes identifies distinct phases of inefficient and coordinated SARS-CoV-2 gene expression.

(A) The 752 spatial transcriptomes with detectable SARS-CoV-2 transcripts were subset, clustered, and further analyzed. For continuity, the trajectories are plotted on A and D, where the white circle represents the starting point, black circles represent branchpoints, and grey represents endpoints. (B) Expression of viral transcripts revealed patterns in distinct clusters. (C) The mean counts of viral RNAs per cluster revealed viral RNA levels were highest in clusters 1>4>2>0>3. (D) Pseudotime trajectory analysis starting at cluster 3, which had the fewest viral transcripts, identified distinct endpoints at clusters 2, 0, and 1. (E) Pearson’s correlation analysis of each cluster revealed significant correlations in viral RNAs only in cluster 1
