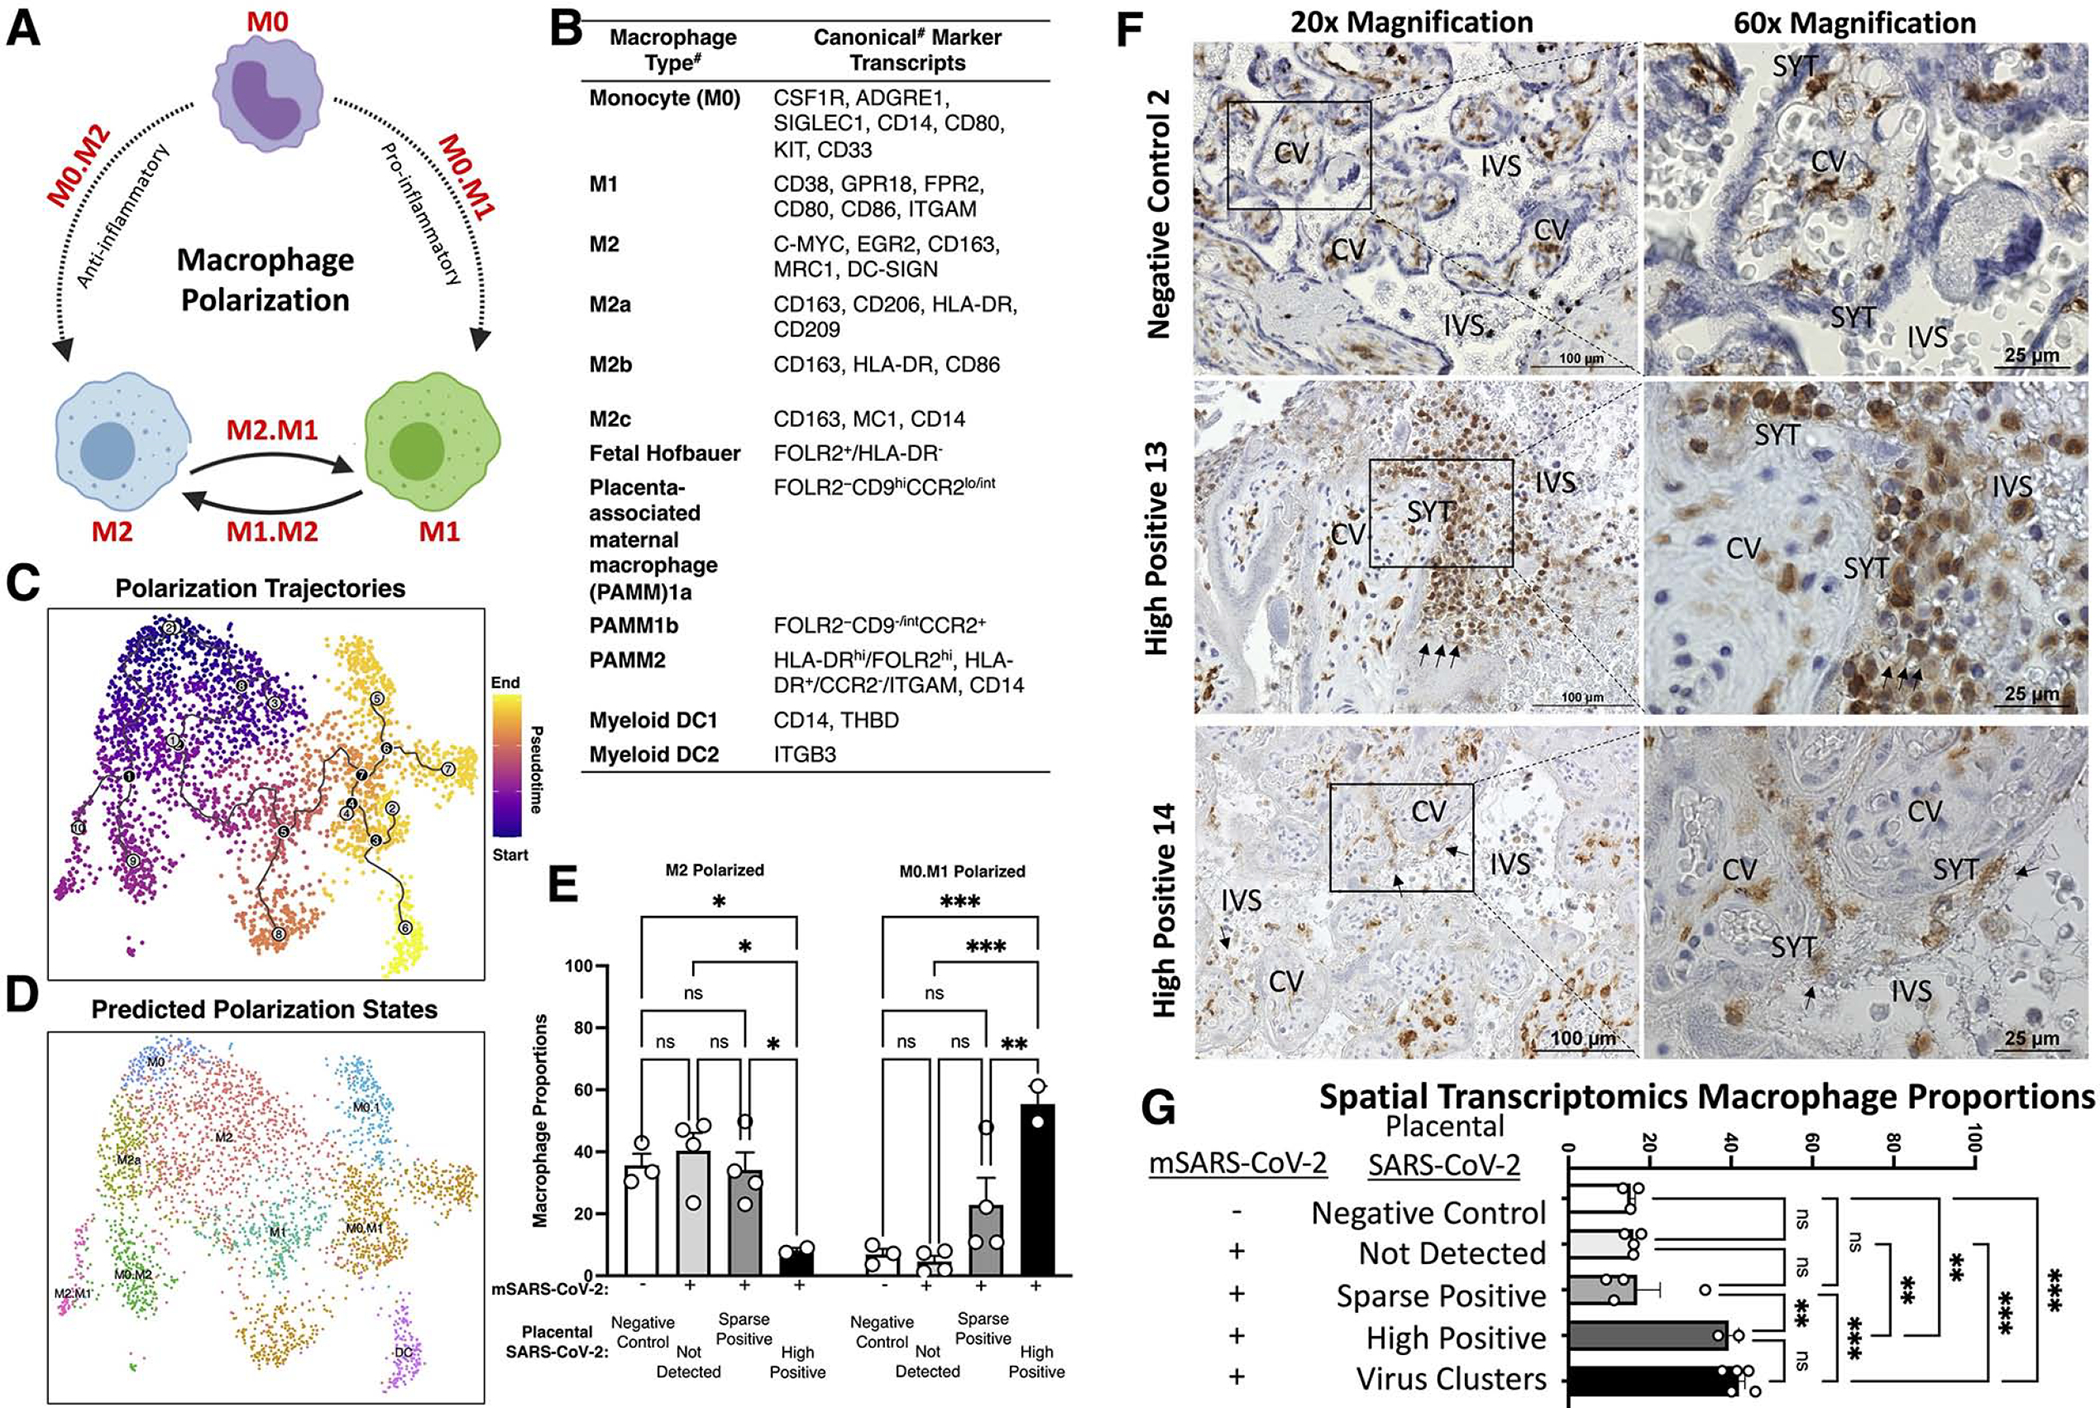
Figure 6. Tracing placental macrophage polarization trajectories identifies depletion of anti-inflammatory M2 macrophages and histiocytic intervillositis in highly positive SARS-CoV-2 placentae.

(A) Schematic of macrophage polarization from naïve monocytes (M0) to pro-inflammatory M1, and anti-inflammatory M2. (B) Canonical markers for each subpopulation. #Note: caveats exist including potential differences by gestational age and between single-cell RNA and protein levels. (C) The 3,180 placental macrophages were analyzed by Monocle3, revealing pseudotime trajectories starting at M0 monocytes and trajectories going to M1 or M2 polarized subpopulations. (D) Using the pseudotime trajectory results, subpopulations were annotated based on predicted polarization states including intermediates (e.g. M0 to M1 is M0.M1).(E) Proportions of macrophages according to predicted polarization states. (F-G) IHC staining for CD163, a classical macrophage marker. Images were taken at 40x magnification. (G) Proportions of all spatial transcriptomes (see Figure 2 and Figure S2c) separated based on virus detection grouping from Figure 2 and the cluster analysis of SARS-CoV-2 positive transcriptomes in Figure 5. Significance of P<0.05 (**P<0.001, ***P<0.0001, ns= P>0.05) was determined by two-way ANOVA with Tukey’s multiple comparisons test. Error bars represent the standard error of the mean
