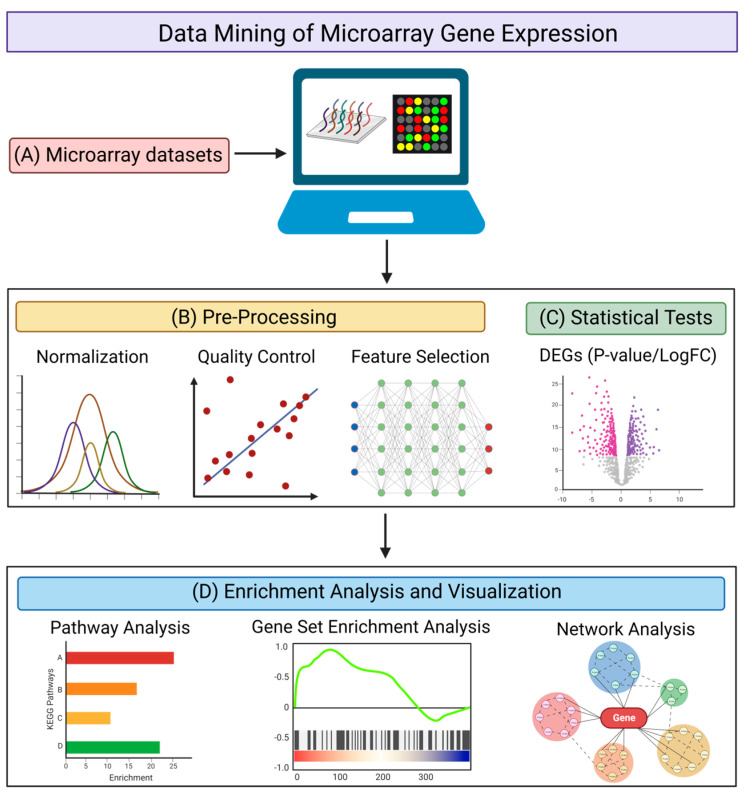
Figure 2.
Pipeline for the data mining of microarray gene expression. (A) Searching for suitable microarray datasets to be analyzed using web-based tools or command line scripts. Different genes identified by microarray analysis are represented by different colors. (B) Pre-processing of datasets via normalization, quality control, and feature selection. (C) Statistical tests to obtain DEGs with corresponding P-values (significance) and LogFC (fold-change). Downregulated genes are illustrated in red and upregulated genes are illustrated in purple. (D) Enrichment analysis and visualization using pathway analysis, gene set enrichment analysis (GSEA), and network analysis to provide a biological interpretation of the DEGs. Different pathways or functional annotations of the DEGs are illustrated by different colors. The figure was created using BioRender.

