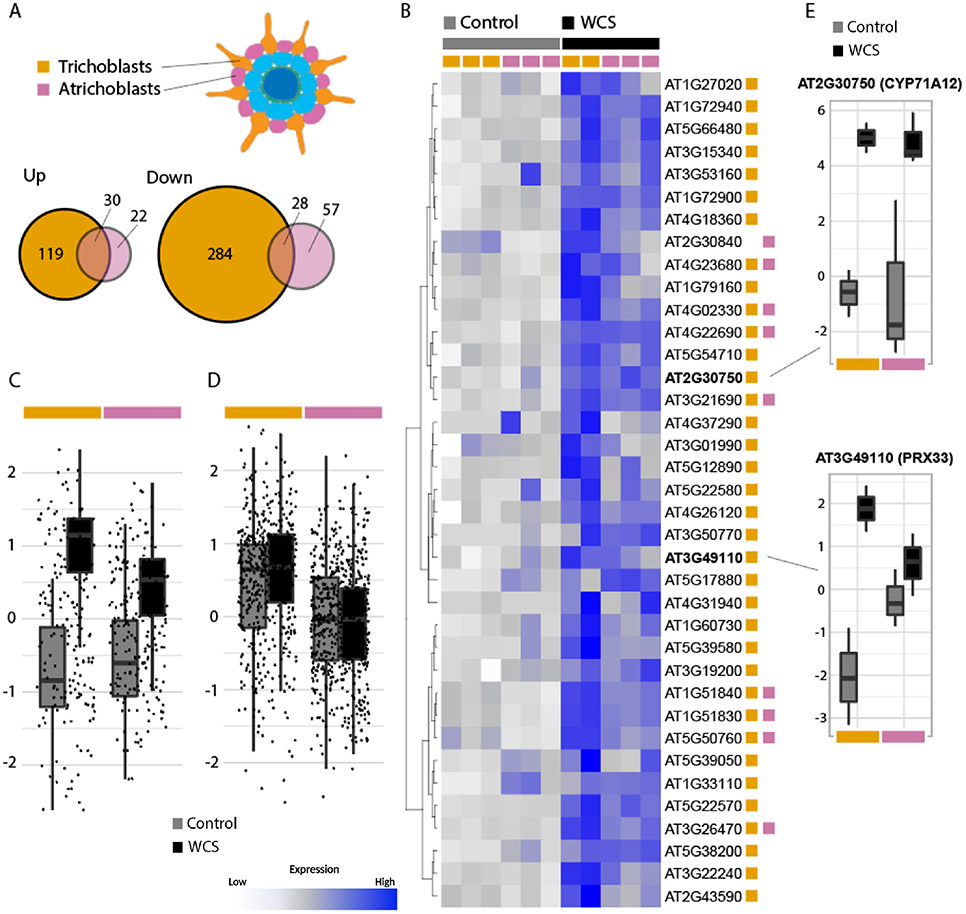
Figure 4. High responsiveness of trichoblasts to root colonization by WCS417.
A) Overlap of the DEGs in response to WCS417 in the trichoblasts and atrichoblasts. B) Heatmap of the expression of genes associated with the GO term defense response (GO:0006952) that were differentially expressed (DE) in either or both epidermal cell types in response to WCS417. DE status in either cell type shown by the colored squares (trichoblasts, orange; atrichoblasts, pink). Heatmap is scaled by row and gene expression is shown as the normalized log-counts-per-million, with low gene expression in white, and high expression in dark blue. C) Scaled (per-gene) expression levels of DEGs as shown in B. D) Scaled (per-gene) expression levels of all genes associated with GO:0006952. E) Expression of candidate marker genes CYP71A12 and PRX33 as normalized log-counts-per-million.

