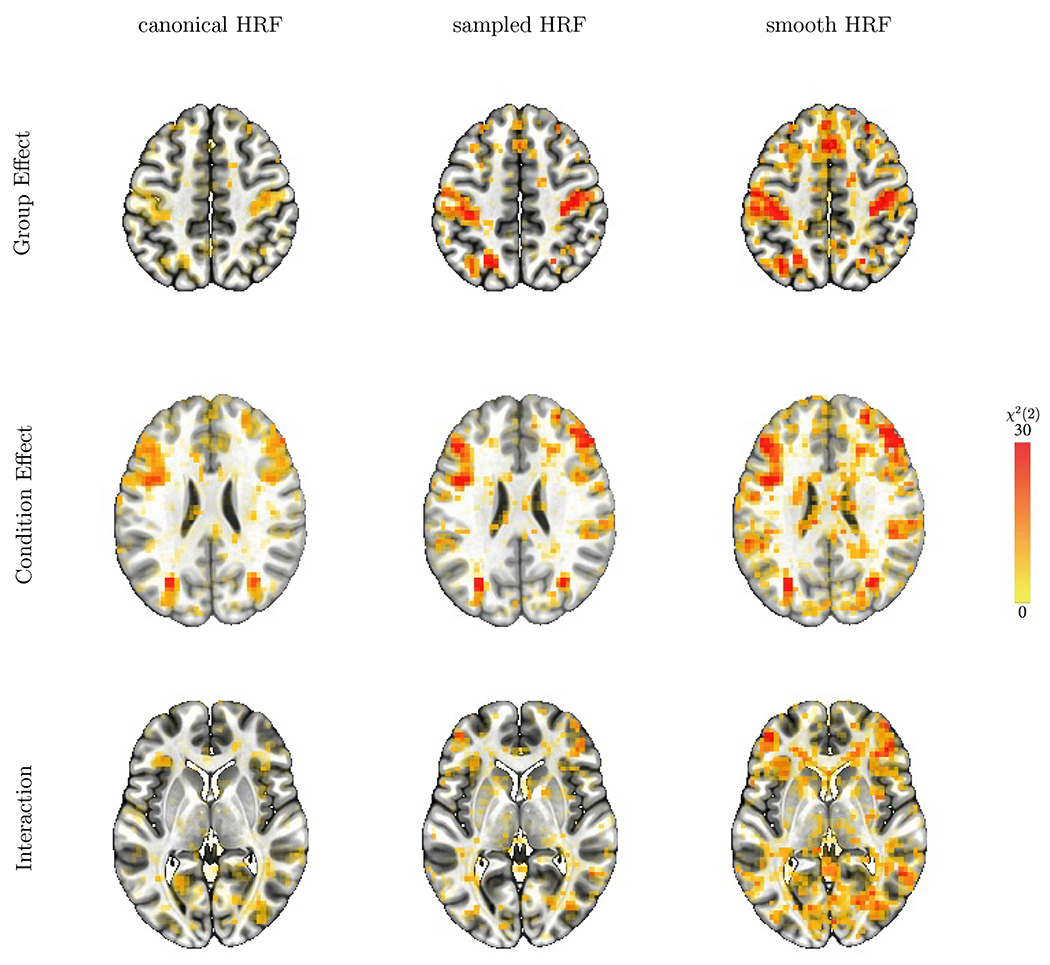
Figure 4:

Statistical comparison of main effects and interactions among the three modeling approaches. Overlay coloration shows χ2(2) values; transparent thresholding at p = 0.01 here and below corresponds to χ2(2) = 9.2. The three different axial slices (rows from the top, downwards) at Z = 49, 25, and 4 are selected to illustrate the statistical evidence comparisons across the modeling approaches (columns) for, respectively, differences between groups and conditions, and the group-by-condition interaction.
