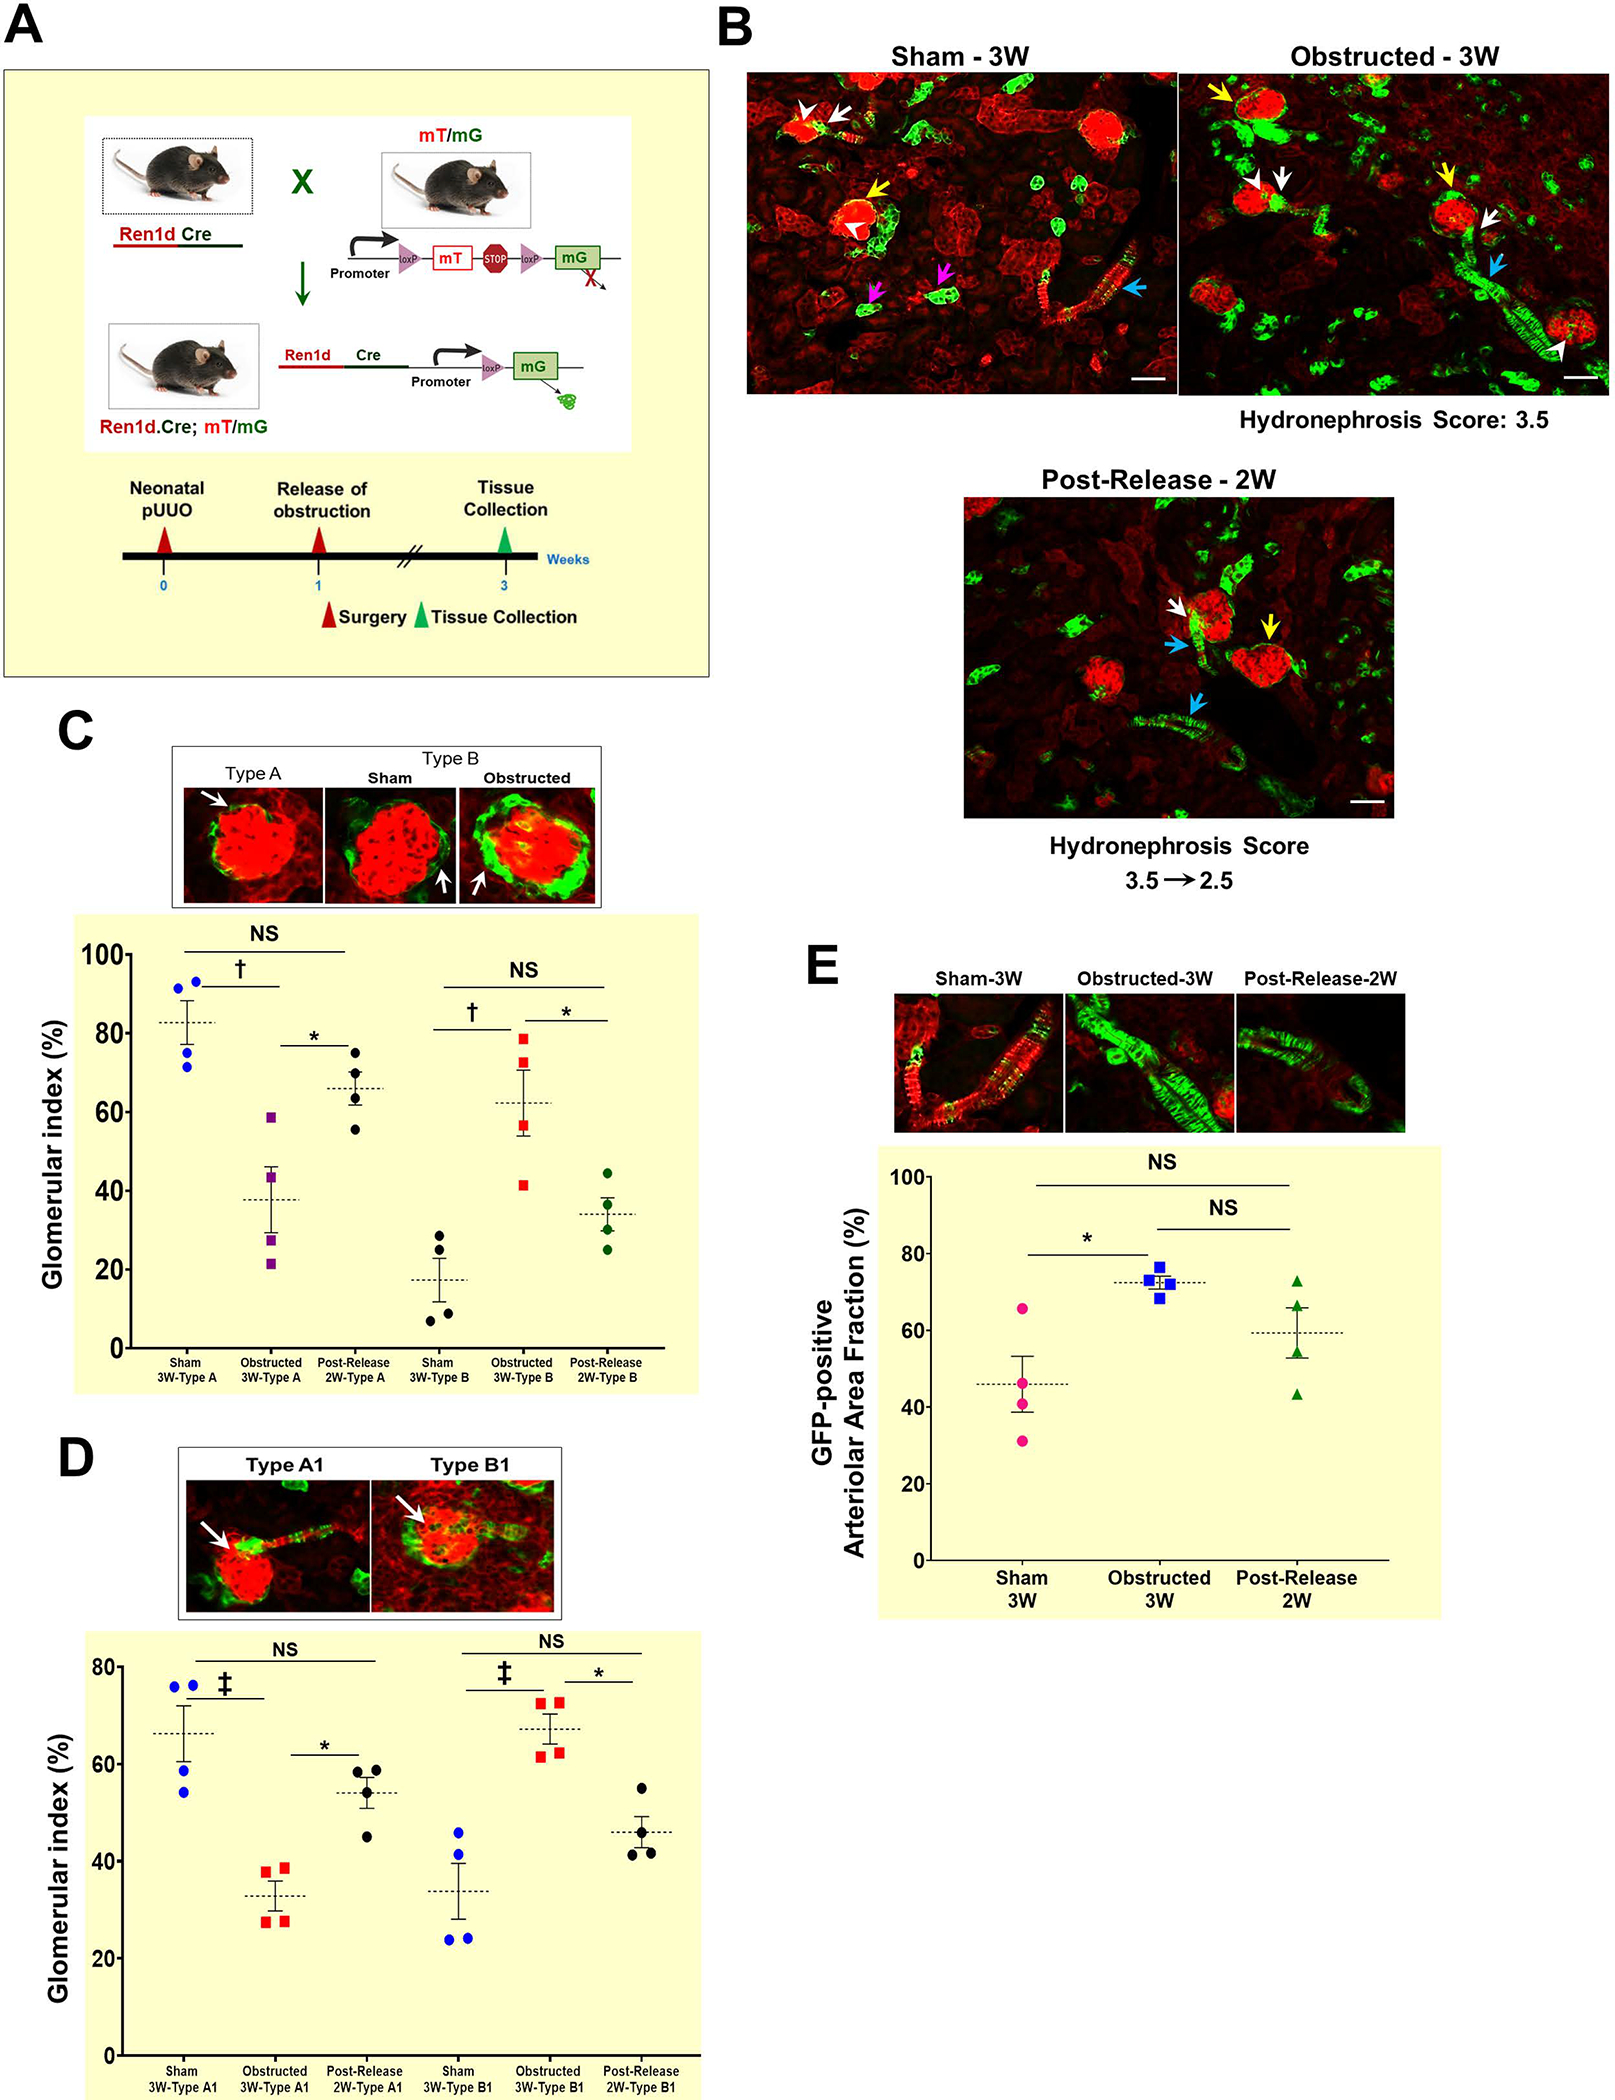
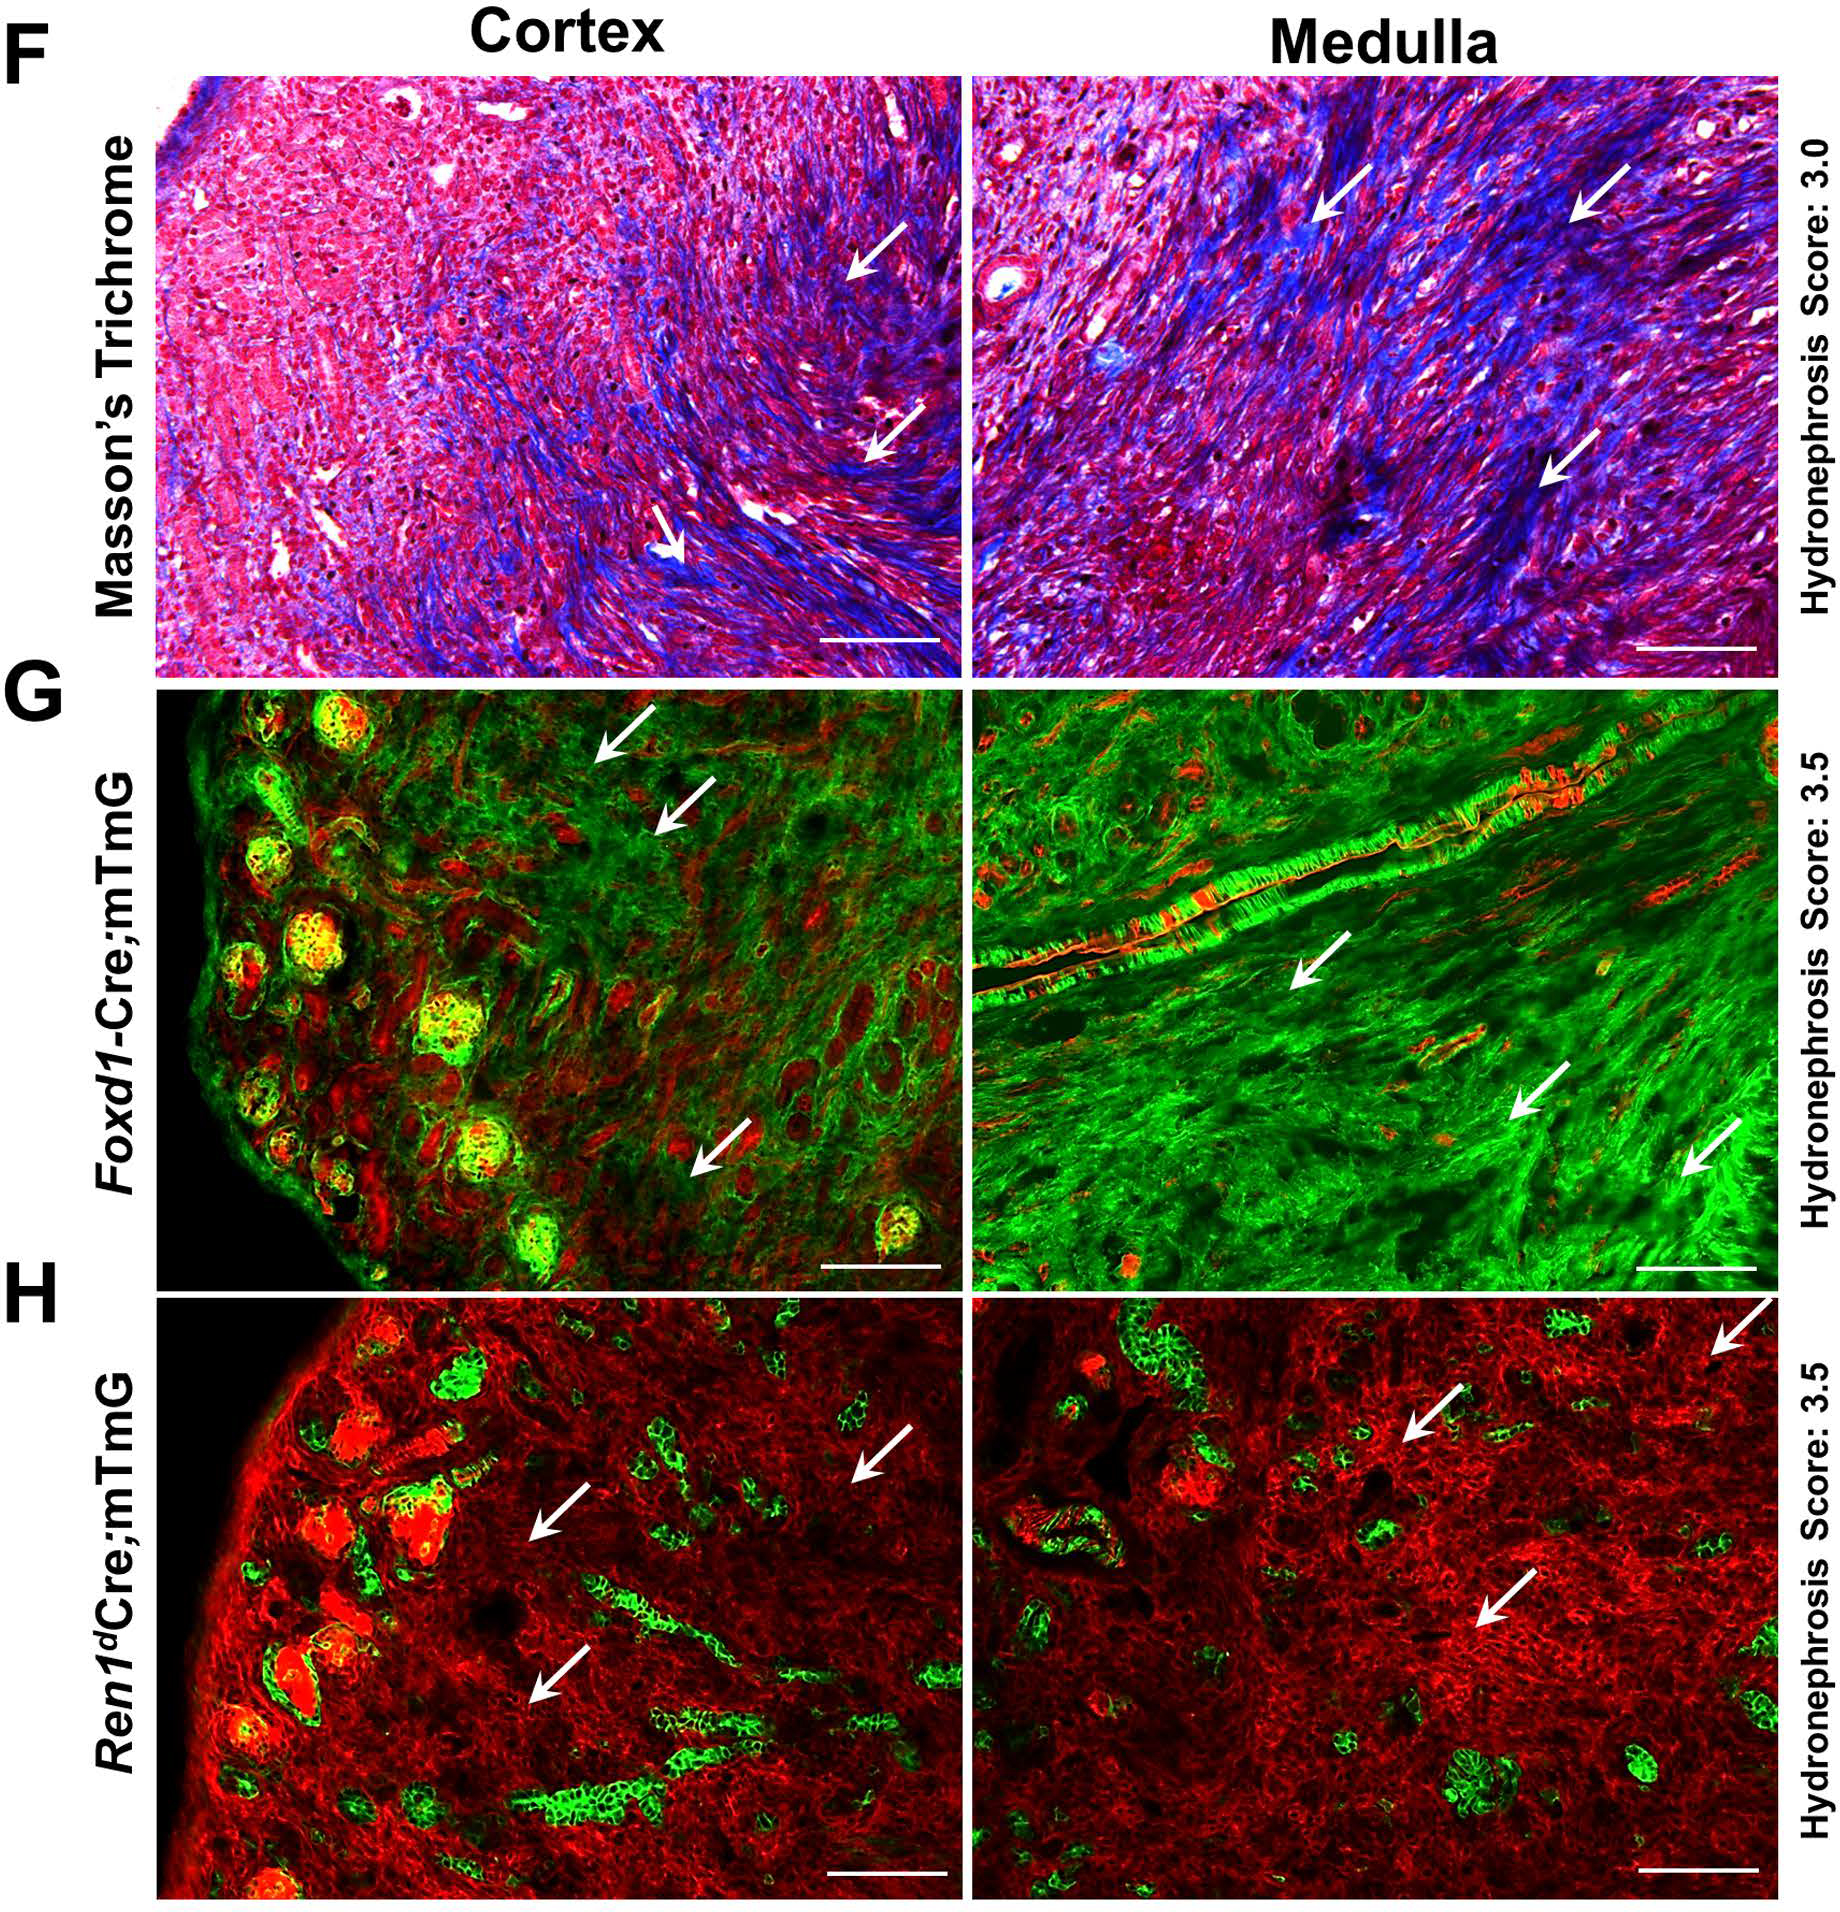
Figure 2. Persistent ureteral obstruction leads to an increase in the CoRL:


(A) Mice expressing GFP in the CoRL were subjected to pUUO and release surgeries, and tissues were collected at 3W after birth for lineage tracing (B) Kidney sections showing GFP labeling in CoRL encompass the renin-producing Juxta-glomerular (JG) cells (white arrows), parietal epithelium surrounding the glomeruli (yellow arrows), smooth muscle cells lining the renal arteries and arterioles (cyan arrows), intra-glomerular mesangium (white arrowhead) and a subset of tubular epithelial cells (pink arrows). Obstructed kidneys showed expansion of the GFP+ CoRL. The kidneys with the obstruction removed, showed a similar pattern of GFP+ cells to the sham-operated kidneys (Scale bar 50μm). (C) The top panel shows a Type A glomerulus with a thin layer of parietal epithelium and Type B glomeruli showing the thickening of the parietal epithelium. Obstructed kidneys showed a significant decrease in the normal Type A glomeruli, with an increase in the Type B glomeruli. Following the release of obstruction, the distribution of Type A and B glomeruli was similar to the sham animals (D) The top panel represents the Type A1 and B1 glomerulus. Only very few GFP+ intra-glomerular mesangial cells are seen in the TypeA1 glomerulus. Type B1 glomerulus displayed expansion of the intra-glomerular mesangium. Type B1 glomeruli were significantly increased following the persistent obstruction for 3W, with a concurrent decrease in the normal Type A1 glomeruli. The status of the Type A1 and B1 glomeruli was not-significantly different between the obstruction-released and sham-operated kidneys (E) The top panel denotes the level of the GFP+ cells in the renal vasculature under different surgery conditions. The GFP+, renin-negative SMCs of the renin-lineage were significantly increased in the kidneys obstructed for 3W compared to the shams. This increase is maintained even at 2W post-release and was not different from the obstructed kidneys. (F-G) Kidneys with persistent obstruction for 3W show collagen-positive fibrotic interstitium (white arrows) by Masson’s Trichrome staining which correspond to the expansion of GFP+ cells of the Foxd1-lineage (white arrows) (H) Obstructed kidneys from Ren1dCre.mTmG mice with a similar hydronephrosis score as in B do not display a surge in the GFP+ cells of renin lineage within the fibrotic interstitial cells (white arrows) indicating that the CoRL may not directly contribute to the progression of interstitial fibrosis during pUUO in neonatal mice (Scale bar 100μm) (*P<0.05; †P<0.01; ‡P<0.001; NS non-significant).
