
Figure 1. Ingestion, annotation, and curation of sequencing data from estradiol stimulated breast cancer cells.
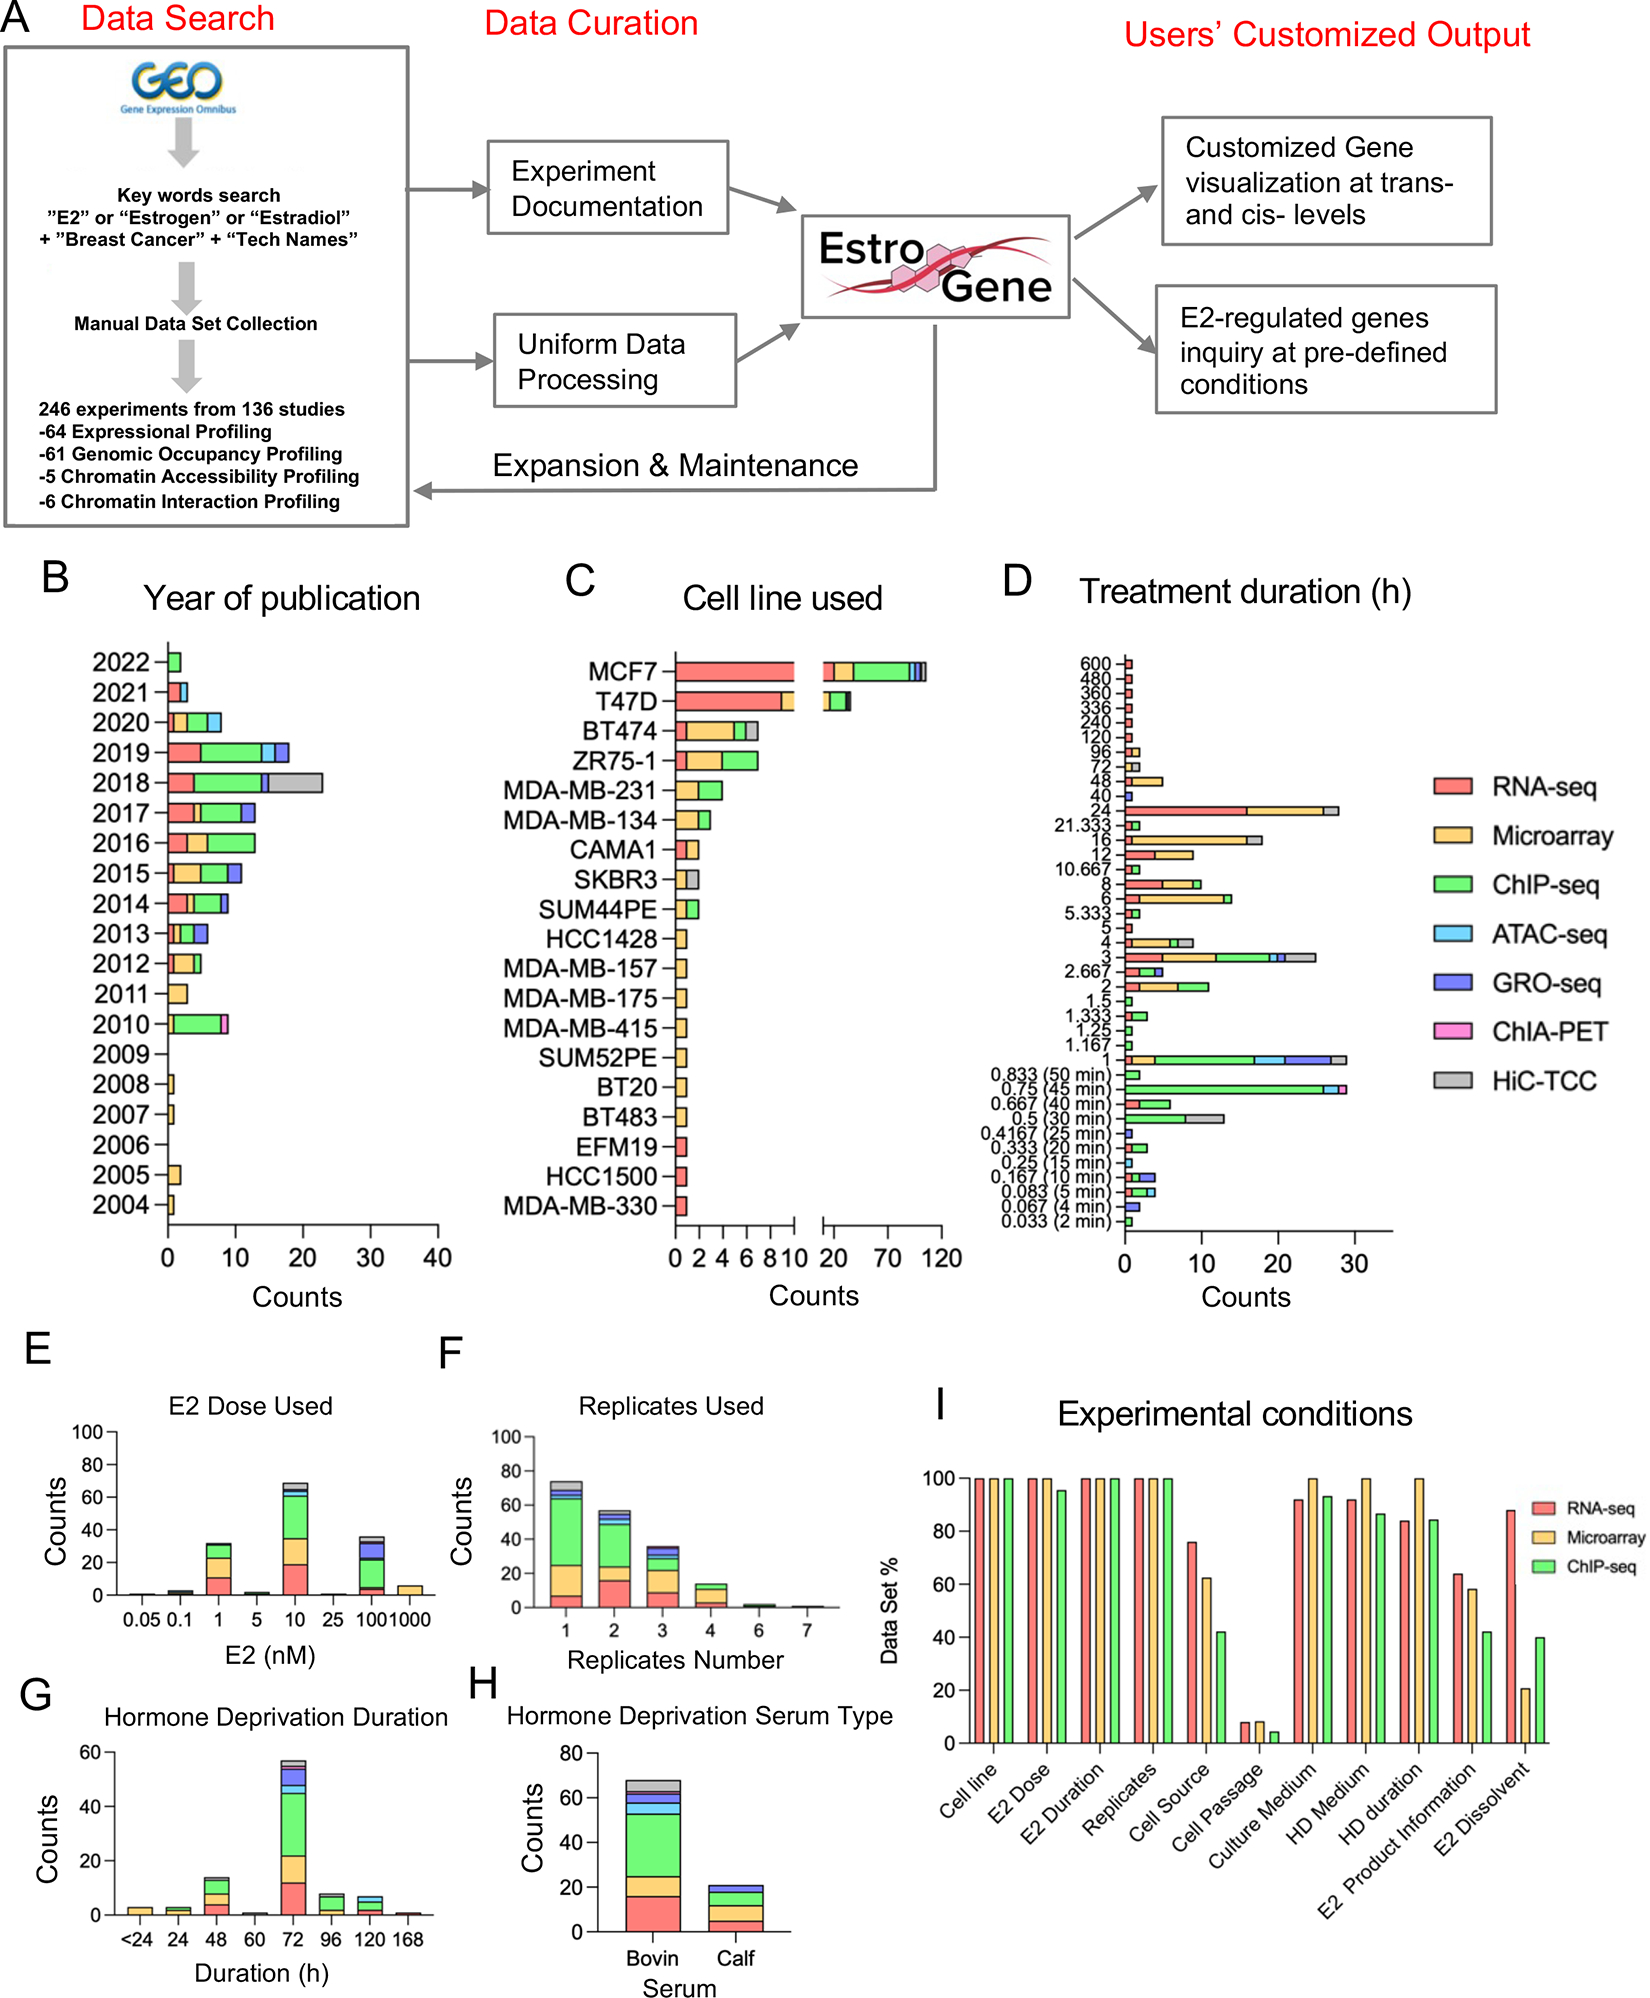
A. A flow chart depicting the process for establishment of the EstroGene database and specify the embedded functions of the browser.
B to G. Stacked histogram showing the metadata separated by technologies across all the curated data sets related to year of data set publication (B), cell line used (C), E2 treatment duration (D), E2 dose selection (E), replicates used (F), hormone deprivation duration (G) and serum type (H).
I. Bar graph showing the percentage of RNA-seq, microarray and ChIP-seq data sets with available detailed experimental terms.