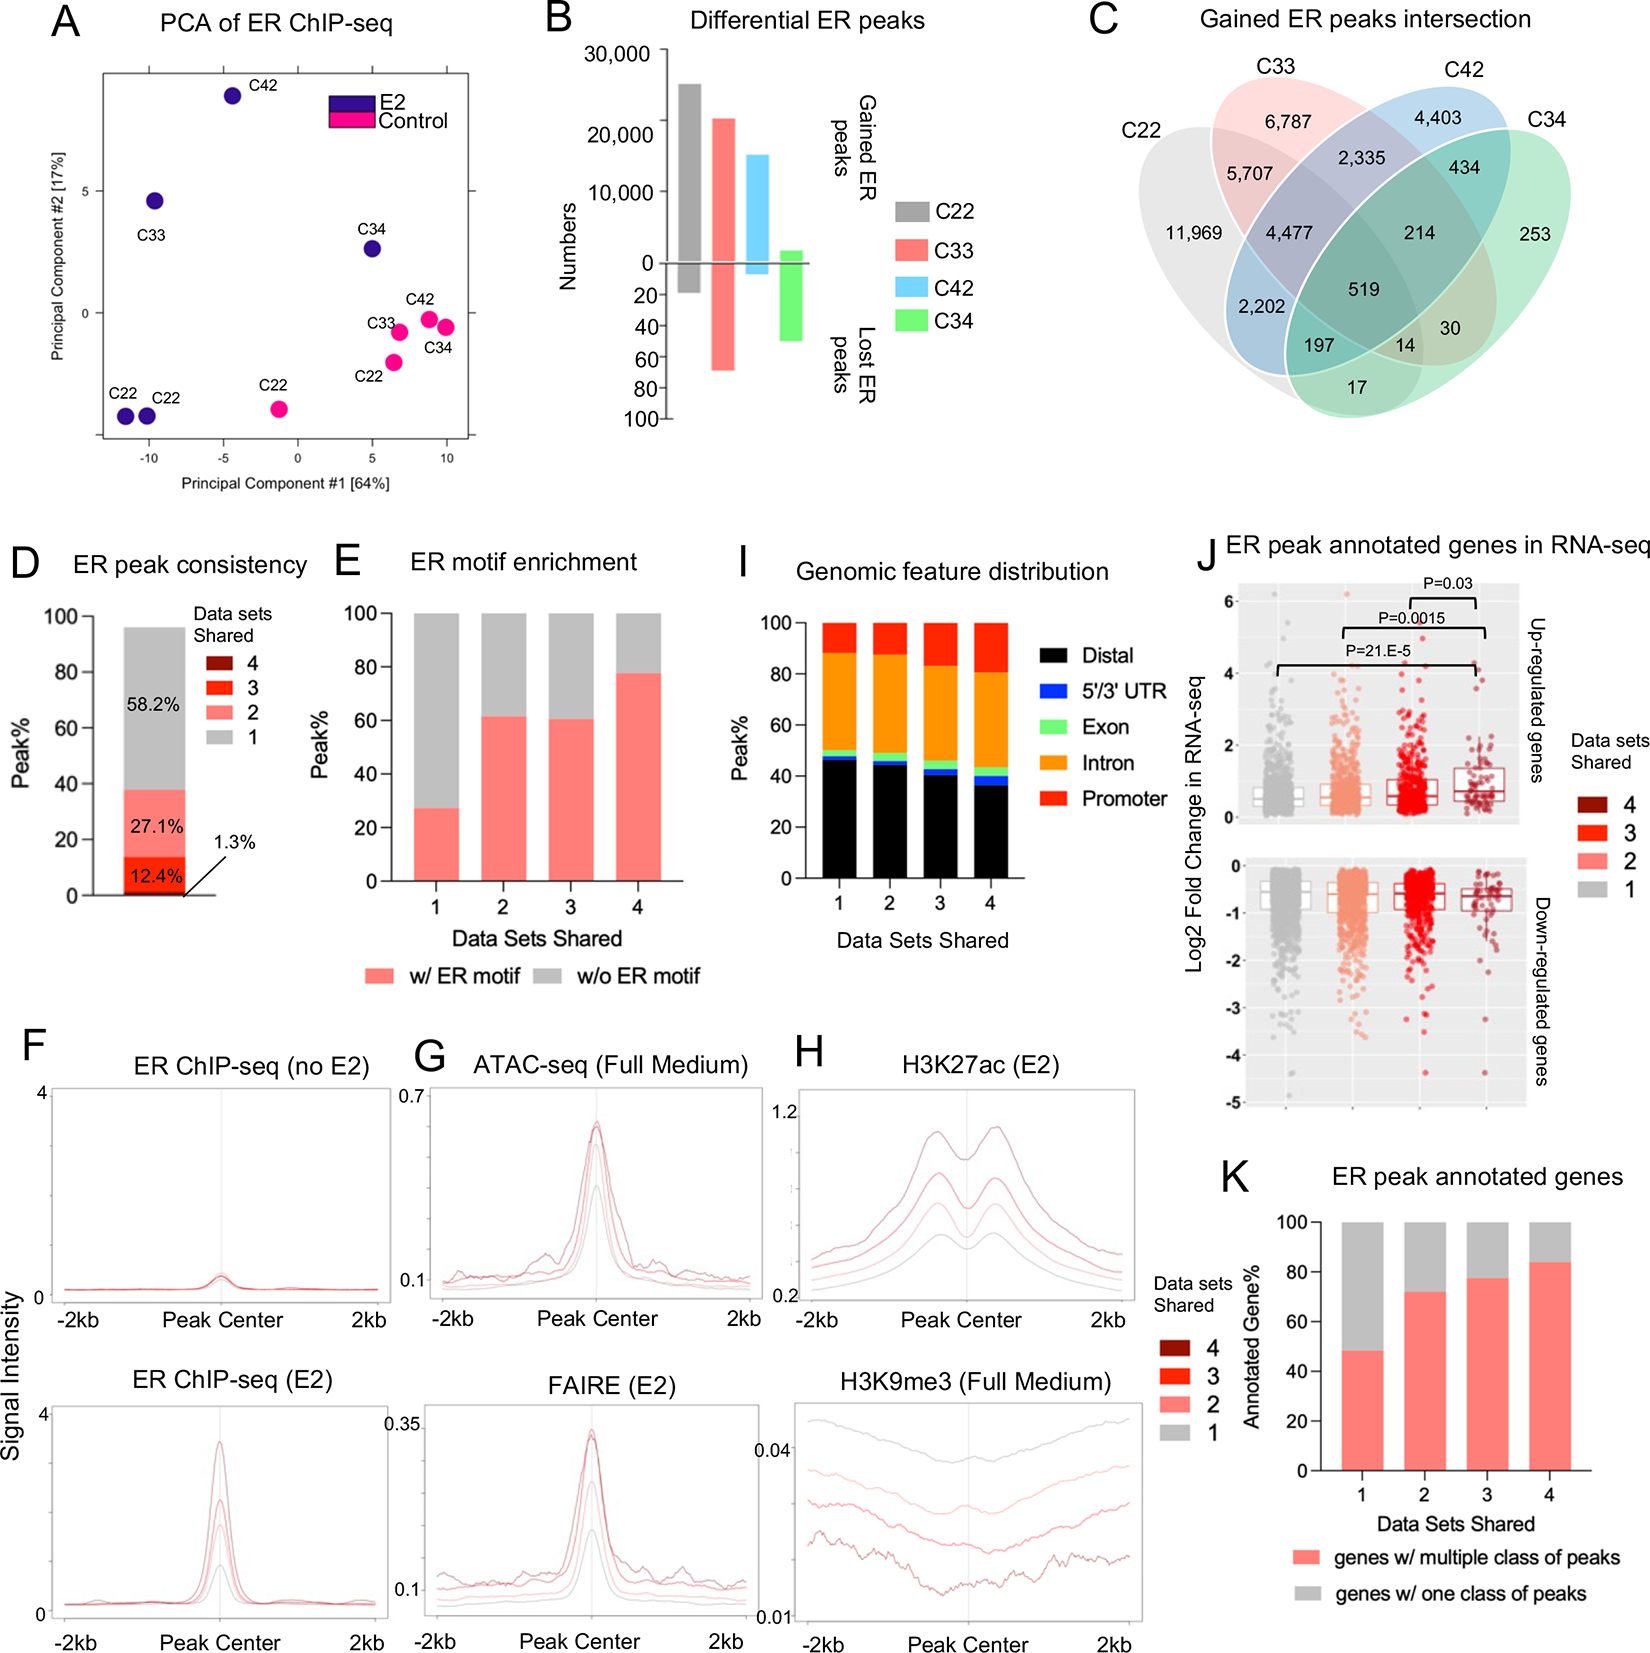
Figure 4. Inter-dataset concordance of estrogen-induced ER genomic binding.

A. Principal component analysis depicting the ER genomic binding variations across four different experiments.
B. Bar plot showing the number of gained and lost ER peaks from four ChIP-seq experiments.
C. Venn diagram showing the intersection of E2-induced gained ER peaks across four ChIP-seq experiments.
D. Stacked bar plot depicting the percentage distribution of gained ER peaks consistent in one to four experiments.
E. Stacked plot representing the percentage of peaks containing ER motif across four peak sets.
F to H. Intensity plot showing the binding signals from ER ChIP-seq in the presence or absence of estrogen (F), ATAC-seq and FAIRE (G) and H3K27ac/H3K9me3 ChIP-seq at the four gained ER peak sets with different cross-data set consistencies. ER ChIP-seq and epigenetic profiling data sets were downloaded from GSE78284, GSE25710, GSE102441, GSE78913 and GSE96517.
I. Stacked plots showing the genomic feature distributions of the four gained ER peak sets with different cross-data set consistencies.
J. Box plots depicting the average log2 fold changes from four RNA-seq experiments in Fig. 3 towards all the up (Top panel) and down (Bottom panel) regulated genes annotated from −/+ 50 kb of the four gained ER peak sets. Mann Whitney U test was used.
K. Stacked plot representing the percentage of annotated genes in J with one or multiple consistency class of gained ER peaks.
