
Figure 5. Establishment of E2 response meta-signature and their association with ER genomic binding.
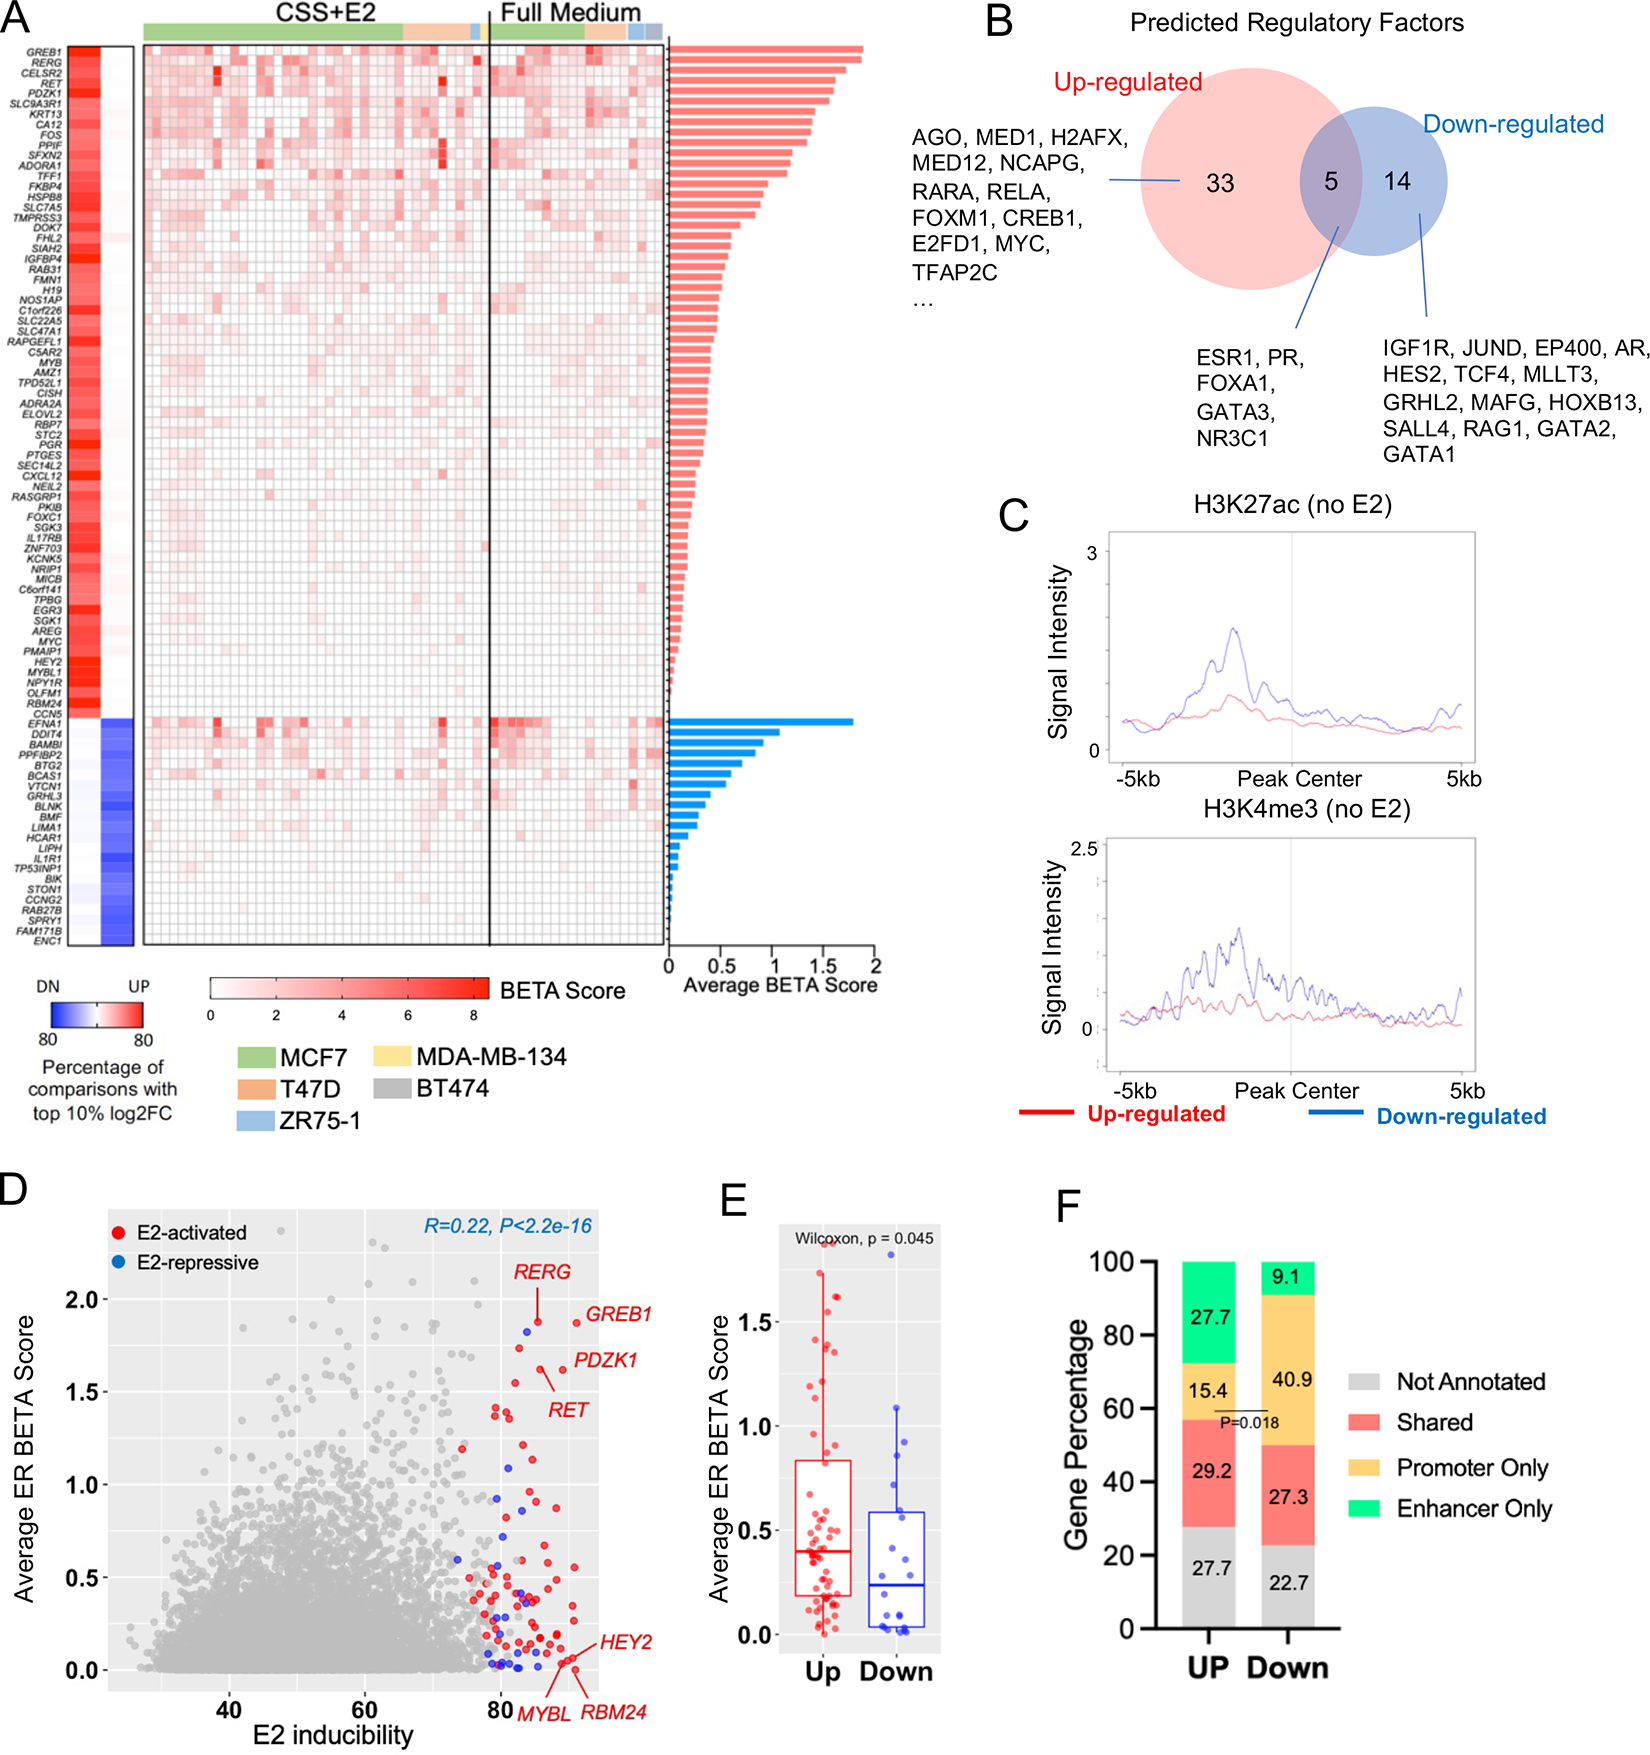
A. Left panel: Heatmap summarizing the 65 and 22 up and downregulated genes that fall in top 10% altered targets by fold changes and consistent in at least 50% of comparisons. Middle panel: Heatmap showing the BETA score of each E2-regulated genes from 60 ER ChIP-seq samples. ChIP-seq experimentes were sorted by CSS+E2 and full medium conditions and cell lines. Right panel: bar plot depicting the average BETA score of each E2-regulated genes. Genes were ranked in descending order of BETA score.
B. Venn diagram showing the overlap of regulatory factors predicted by LISA between highly consistent E2- up- and down-regulated gene sets shown in A.
C. Intensity plot showing the signals from ChIP-seq of H3K4me3 and H3K27ac (no E2) on −/+5kb region of TSS of all E2-up- and down-regulated genes. Epigenetic profiling data sets were downloaded from GSE78913 and GSE57436.
D. Scattered plot showing the correlation of average BETA score from 60 ER ChIP-seq and E2 inducibility from 146 transcriptomic comparisons of 24,196 genes. High-confident E2-induced and repressed genes were labelled with red and blue. Pearson correlation was applied.
E. Box plot comparing the average BETA score of 65 E2-induced and 22 E2-repressed genes. Mann Whitney U test was used.
F. Stacked plot depicting the distribution of E2-regulated up and down-regulated genes that are annotatable by enhancer and/or promoter regions. Fisher’s exact test was performed to compare promoter only gene enrichment.